LinuCエヴァンジェリスト・Open Source Summit Japan 2022ボランティアリーダーの鯨井貴博@opensourcetechです。
はじめに
今回はPrometheus・Grafana・各種Exporterによるモニタリング(監視)を使ってみようと思います。
概要とそれぞれの役割をざっくり説明すると、以下のようなになります。
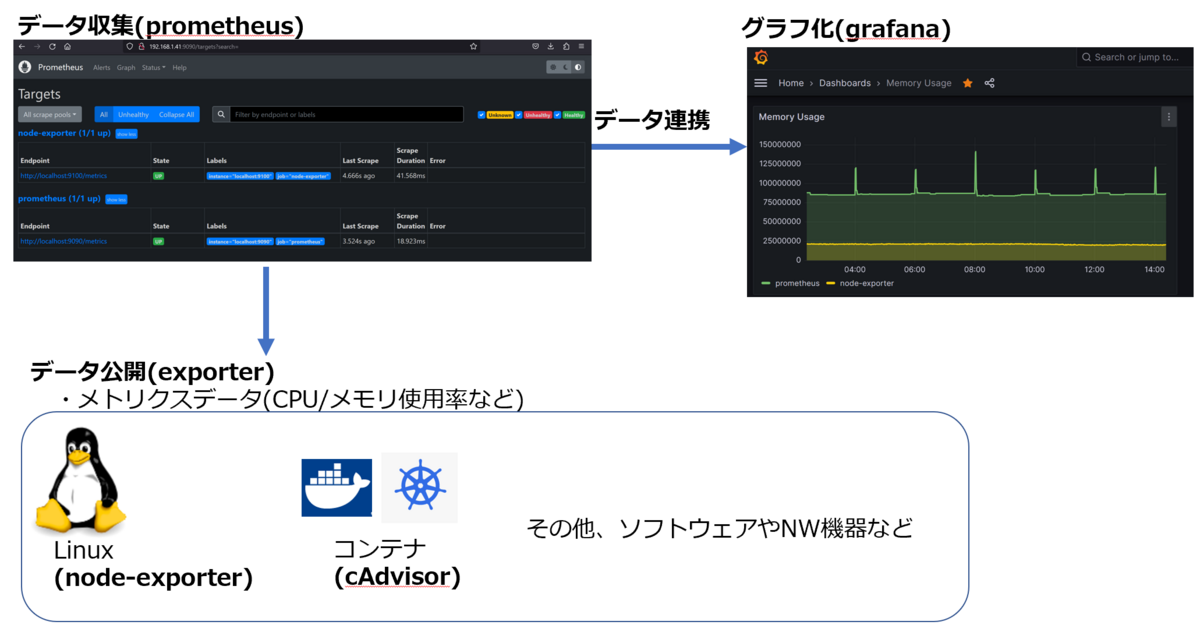
Prometheus:データ収集
Grafana:データのグラフ化
Exporter:データの公開(コンテナだとcAdvisor、Linuxホストだとnode-exporterなど)
なお、上記ソフトウェアのインストールや監視対象(Linuxホストやコンテナ)として、
こちらの記事で作成したkubernetesクラスター(Ubuntu22.04)を利用しています。
※注意:今回は主に/tmpで作業しているので、実際に環境構築する場合は/usr/localなど各種ソフトウェアを適した場所に配置ください。
①Prometheusの構築
まずは、Prometheusのパッケージ入手、解凍などです。
Welcome to Ubuntu 22.04.2 LTS (GNU/Linux 5.15.0-67-generic x86_64)

 * Documentation:  https://help.ubuntu.com
 * Management:     https://landscape.canonical.com
 * Support:        https://ubuntu.com/advantage

  System information as of Tue May  9 06:01:06 UTC 2023

  System load:             0.72705078125
  Usage of /:              23.3% of 37.10GB
  Memory usage:            39%
  Swap usage:              0%
  Processes:               177
  Users logged in:         1
  IPv4 address for enp1s0: 192.168.1.41
  IPv6 address for enp1s0: 240f:32:57b8:1:5054:ff:fe8e:5428
  IPv4 address for tunl0:  10.0.241.64

 * Strictly confined Kubernetes makes edge and IoT secure. Learn how MicroK8s
   just raised the bar for easy, resilient and secure K8s cluster deployment.

   https://ubuntu.com/engage/secure-kubernetes-at-the-edge

 * Introducing Expanded Security Maintenance for Applications.
   Receive updates to over 25,000 software packages with your
   Ubuntu Pro subscription. Free for personal use.

     https://ubuntu.com/pro

Expanded Security Maintenance for Applications is not enabled.

45 updates can be applied immediately.
To see these additional updates run: apt list --upgradable

Enable ESM Apps to receive additional future security updates.
See https://ubuntu.com/esm or run: sudo pro status


*** System restart required ***
Last login: Sun Apr 30 15:31:55 2023 from 192.168.1.124

kubeuser@master01:~$ cd /tmp

kubeuser@master01:/tmp$ ls

kubeuser@master01:/tmp$ wget https://github.com/prometheus/prometheus/releases/download/v2.43.1/prometheus-2.43.1.linux-amd64.tar.gz

--2023-05-09 06:03:59--  https://github.com/prometheus/prometheus/releases/download/v2.43.1/prometheus-2.43.1.linux-amd64.tar.gz
Resolving github.com (github.com)... 20.27.177.113
Connecting to github.com (github.com)|20.27.177.113|:443... connected.
HTTP request sent, awaiting response... 302 Found
Location: https://objects.githubusercontent.com/github-production-release-asset-2e65be/6838921/cb7486be-c511-4bf6-975b-fb1b4e7f3943?X-Amz-Algorithm=AWS4-HMAC-SHA256&X-Amz-Credential=AKIAIWNJYAX4CSVEH53A%2F20230509%2Fus-east-1%2Fs3%2Faws4_request&X-Amz-Date=20230509T060359Z&X-Amz-Expires=300&X-Amz-Signature=a31575372dd885dc2361d4f5c7c02a78f9ad6b1a3f18f7b2b57a25f477b42ac0&X-Amz-SignedHeaders=host&actor_id=0&key_id=0&repo_id=6838921&response-content-disposition=attachment%3B%20filename%3Dprometheus-2.43.1.linux-amd64.tar.gz&response-content-type=application%2Foctet-stream [following]
--2023-05-09 06:03:59--  https://objects.githubusercontent.com/github-production-release-asset-2e65be/6838921/cb7486be-c511-4bf6-975b-fb1b4e7f3943?X-Amz-Algorithm=AWS4-HMAC-SHA256&X-Amz-Credential=AKIAIWNJYAX4CSVEH53A%2F20230509%2Fus-east-1%2Fs3%2Faws4_request&X-Amz-Date=20230509T060359Z&X-Amz-Expires=300&X-Amz-Signature=a31575372dd885dc2361d4f5c7c02a78f9ad6b1a3f18f7b2b57a25f477b42ac0&X-Amz-SignedHeaders=host&actor_id=0&key_id=0&repo_id=6838921&response-content-disposition=attachment%3B%20filename%3Dprometheus-2.43.1.linux-amd64.tar.gz&response-content-type=application%2Foctet-stream
Resolving objects.githubusercontent.com (objects.githubusercontent.com)... 185.199.109.133, 185.199.110.133, 185.199.111.133, ...
Connecting to objects.githubusercontent.com (objects.githubusercontent.com)|185.199.109.133|:443... connected.
HTTP request sent, awaiting response... 200 OK
Length: 91086835 (87M) [application/octet-stream]
Saving to: ‘prometheus-2.43.1.linux-amd64.tar.gz’

prometheus-2.43.1.linux-a 100%[====================================>]  86.87M  10.8MB/s    in 8.0s

2023-05-09 06:04:08 (10.9 MB/s) - ‘prometheus-2.43.1.linux-amd64.tar.gz’ saved [91086835/91086835]

kubeuser@master01:/tmp$ ls
mprometheus-2.43.1.linux-amd64.tar.gz

kubeuser@master01:/tmp$ tar xvzf prometheus-2.43.1.linux-amd64.tar.gz

prometheus-2.43.1.linux-amd64/
prometheus-2.43.1.linux-amd64/console_libraries/
prometheus-2.43.1.linux-amd64/console_libraries/menu.lib
prometheus-2.43.1.linux-amd64/console_libraries/prom.lib
prometheus-2.43.1.linux-amd64/prometheus.yml
prometheus-2.43.1.linux-amd64/consoles/
prometheus-2.43.1.linux-amd64/consoles/node-disk.html
prometheus-2.43.1.linux-amd64/consoles/index.html.example
prometheus-2.43.1.linux-amd64/consoles/node.html
prometheus-2.43.1.linux-amd64/consoles/prometheus-overview.html
prometheus-2.43.1.linux-amd64/consoles/node-overview.html
prometheus-2.43.1.linux-amd64/consoles/node-cpu.html
prometheus-2.43.1.linux-amd64/consoles/prometheus.html
prometheus-2.43.1.linux-amd64/promtool
prometheus-2.43.1.linux-amd64/NOTICE
prometheus-2.43.1.linux-amd64/prometheus
prometheus-2.43.1.linux-amd64/LICENSE

kubeuser@master01:/tmp$ ls -lh prometheus-2.43.1.linux-amd64
total 221M
-rw-r--r--  1 kubeuser kubeuser  12K May  4 22:01 LICENSE
-rw-r--r--  1 kubeuser kubeuser 3.7K May  4 22:01 NOTICE
drwxr-xr-x  2 kubeuser kubeuser 4.0K May  4 22:01 console_libraries
drwxr-xr-x  2 kubeuser kubeuser 4.0K May  4 22:01 consoles
drwxrwxr-x 14 kubeuser kubeuser 4.0K May 14 01:44 data
-rwxr-xr-x  1 kubeuser kubeuser 114M May  4 20:59 prometheus
-rw-r--r--  1 kubeuser kubeuser 1.1K May 13 12:23 prometheus.yml
-rwxr-xr-x  1 kubeuser kubeuser 107M May  4 21:02 promtool
上記にあるprometheus.ymlが設定ファイル、prometheus.ymlが実行ファイルとなります。
設定(prometheus.yml)は、以下のようになっており、
job_name = データ収集先に命名する名前
targets = データ収集先のURL
を指定します。
※今回データを収集する、node-exporterとcAdvisorが設定済み。
kubeuser@master01:/tmp$ cat prometheus-2.43.1.linux-amd64/prometheus.yml
# my global config
global:
  scrape_interval: 15s # Set the scrape interval to every 15 seconds. Default is every 1 minute.
  evaluation_interval: 15s # Evaluate rules every 15 seconds. The default is every 1 minute.
  # scrape_timeout is set to the global default (10s).

# Alertmanager configuration
alerting:
  alertmanagers:
    - static_configs:
        - targets:
          # - alertmanager:9093

# Load rules once and periodically evaluate them according to the global 'evaluation_interval'.
rule_files:
  # - "first_rules.yml"
  # - "second_rules.yml"

# A scrape configuration containing exactly one endpoint to scrape:
# Here it's Prometheus itself.
scrape_configs:
  # The job name is added as a label `job=<job_name>` to any timeseries scraped from this config.
  - job_name: "prometheus"

    # metrics_path defaults to '/metrics'
    # scheme defaults to 'http'.

    static_configs:
      - targets: ["localhost:9090"]

  - job_name: "node-exporter"
    static_configs:
      - targets: ["localhost:9100"]

  - job_name: "cadvisor"
    static_configs:
      - targets: ["192.168.1.55:8080"]
起動は以下のようにし、ctrl+cで停止します。
kubeuser@master01:/tmp/prometheus-2.43.1.linux-amd64$ ./prometheus --config.file=./prometheus.yml
ts=2023-05-14T02:01:56.894Z caller=main.go:520 level=info msg="No time or size retention was set so using the default time retention" duration=15d
ts=2023-05-14T02:01:56.895Z caller=main.go:564 level=info msg="Starting Prometheus Server" mode=server version="(version=2.43.1, branch=HEAD, revision=e278195e3983c966c2a0f42211f62fa8f40c5561)"
ts=2023-05-14T02:01:56.895Z caller=main.go:569 level=info build_context="(go=go1.19.9, platform=linux/amd64, user=root@fdbae5f7538f, date=20230504-20:56:42, tags=netgo,builtinassets)"
ts=2023-05-14T02:01:56.895Z caller=main.go:570 level=info host_details="(Linux 5.15.0-67-generic #74-Ubuntu SMP Wed Feb 22 14:14:39 UTC 2023 x86_64 master01 (none))"
ts=2023-05-14T02:01:56.895Z caller=main.go:571 level=info fd_limits="(soft=1048576, hard=1048576)"
ts=2023-05-14T02:01:56.895Z caller=main.go:572 level=info vm_limits="(soft=unlimited, hard=unlimited)"
ts=2023-05-14T02:01:56.900Z caller=web.go:561 level=info component=web msg="Start listening for connections" address=0.0.0.0:9090
ts=2023-05-14T02:01:56.901Z caller=main.go:1005 level=info msg="Starting TSDB ..."
ts=2023-05-14T02:01:56.902Z caller=repair.go:56 level=info component=tsdb msg="Found healthy block" mint=1683612402284 maxt=1683633600000 ulid=01H00Q9MDBJH8N8XFDDYZCAR6H
ts=2023-05-14T02:01:56.902Z caller=repair.go:56 level=info component=tsdb msg="Found healthy block" mint=1683633611131 maxt=1683698400000 ulid=01H02N35KQNY2VNC11AW3ST6Y3
ts=2023-05-14T02:01:56.902Z caller=repair.go:56 level=info component=tsdb msg="Found healthy block" mint=1683698411135 maxt=1683763200000 ulid=01H04JWQ062WVNWY9DPAGV48NQ
ts=2023-05-14T02:01:56.902Z caller=tls_config.go:232 level=info component=web msg="Listening on" address=[::]:9090
ts=2023-05-14T02:01:56.902Z caller=tls_config.go:235 level=info component=web msg="TLS is disabled." http2=false address=[::]:9090
ts=2023-05-14T02:01:56.902Z caller=repair.go:56 level=info component=tsdb msg="Found healthy block" mint=1683763211134 maxt=1683828000000 ulid=01H06GP9KQX5BQMPQFGAT1EYNZ
ts=2023-05-14T02:01:56.903Z caller=repair.go:56 level=info component=tsdb msg="Found healthy block" mint=1683828011131 maxt=1683864000000 ulid=01H0AK4XE94P3NRZJY9XEKQRKX
ts=2023-05-14T02:01:56.903Z caller=repair.go:56 level=info component=tsdb msg="Found healthy block" mint=1683966776133 maxt=1683979200000 ulid=01H0B0WB68NYT4Q36S9ARN9V10
ts=2023-05-14T02:01:56.903Z caller=repair.go:56 level=info component=tsdb msg="Found healthy block" mint=1684000801299 maxt=1684008000000 ulid=01H0BEKQGX6G2FFP4FG7C80QRZ
ts=2023-05-14T02:01:56.903Z caller=repair.go:56 level=info component=tsdb msg="Found healthy block" mint=1684008000045 maxt=1684015200000 ulid=01H0BNFERP8AP1GH0CMTZEMNEN
ts=2023-05-14T02:01:56.903Z caller=repair.go:56 level=info component=tsdb msg="Found healthy block" mint=1683979205281 maxt=1684000800000 ulid=01H0BNFG6HSXJPV2FCEN1Y5DD1
ts=2023-05-14T02:01:56.904Z caller=repair.go:56 level=info component=tsdb msg="Found healthy block" mint=1684015200247 maxt=1684022400000 ulid=01H0BWB628Q8DW3A5A739V0BKP
ts=2023-05-14T02:01:56.914Z caller=head.go:587 level=info component=tsdb msg="Replaying on-disk memory mappable chunks if any"
ts=2023-05-14T02:01:56.926Z caller=head.go:658 level=info component=tsdb msg="On-disk memory mappable chunks replay completed" duration=12.275571ms
ts=2023-05-14T02:01:56.926Z caller=head.go:664 level=info component=tsdb msg="Replaying WAL, this may take a while"
ts=2023-05-14T02:01:56.961Z caller=head.go:700 level=info component=tsdb msg="WAL checkpoint loaded"
ts=2023-05-14T02:01:57.065Z caller=head.go:735 level=info component=tsdb msg="WAL segment loaded" segment=45 maxSegment=48
ts=2023-05-14T02:01:57.232Z caller=head.go:735 level=info component=tsdb msg="WAL segment loaded" segment=46 maxSegment=48
ts=2023-05-14T02:01:57.338Z caller=head.go:735 level=info component=tsdb msg="WAL segment loaded" segment=47 maxSegment=48
ts=2023-05-14T02:01:57.338Z caller=head.go:735 level=info component=tsdb msg="WAL segment loaded" segment=48 maxSegment=48
ts=2023-05-14T02:01:57.338Z caller=head.go:772 level=info component=tsdb msg="WAL replay completed" checkpoint_replay_duration=34.9038ms wal_replay_duration=377.15323ms wbl_replay_duration=251ns total_replay_duration=424.428782ms
ts=2023-05-14T02:01:57.344Z caller=main.go:1026 level=info fs_type=EXT4_SUPER_MAGIC
ts=2023-05-14T02:01:57.344Z caller=main.go:1029 level=info msg="TSDB started"
ts=2023-05-14T02:01:57.344Z caller=main.go:1209 level=info msg="Loading configuration file" filename=./prometheus.yml
ts=2023-05-14T02:01:57.346Z caller=main.go:1246 level=info msg="Completed loading of configuration file" filename=./prometheus.yml totalDuration=1.933101ms db_storage=2.003µs remote_storage=2.095µs web_handler=660ns query_engine=1.165µs scrape=706.04µs scrape_sd=92.434µs notify=552.527µs notify_sd=20.381µs rules=1.404µs tracing=99.07µs
ts=2023-05-14T02:01:57.346Z caller=main.go:990 level=info msg="Server is ready to receive web requests."
ts=2023-05-14T02:01:57.346Z caller=manager.go:974 level=info component="rule manager" msg="Starting rule manager..."
以後のCLI操作は、別のCLIを新たに立ち上げる必要がありますが、
面倒な場合はnohupを使うといいです。
kubeuser@master01:/tmp/prometheus-2.43.1.linux-amd64$ nohup ./prometheus --config.file=./prometheus.yml > /dev/null 2>&1 &
[1] 2532121
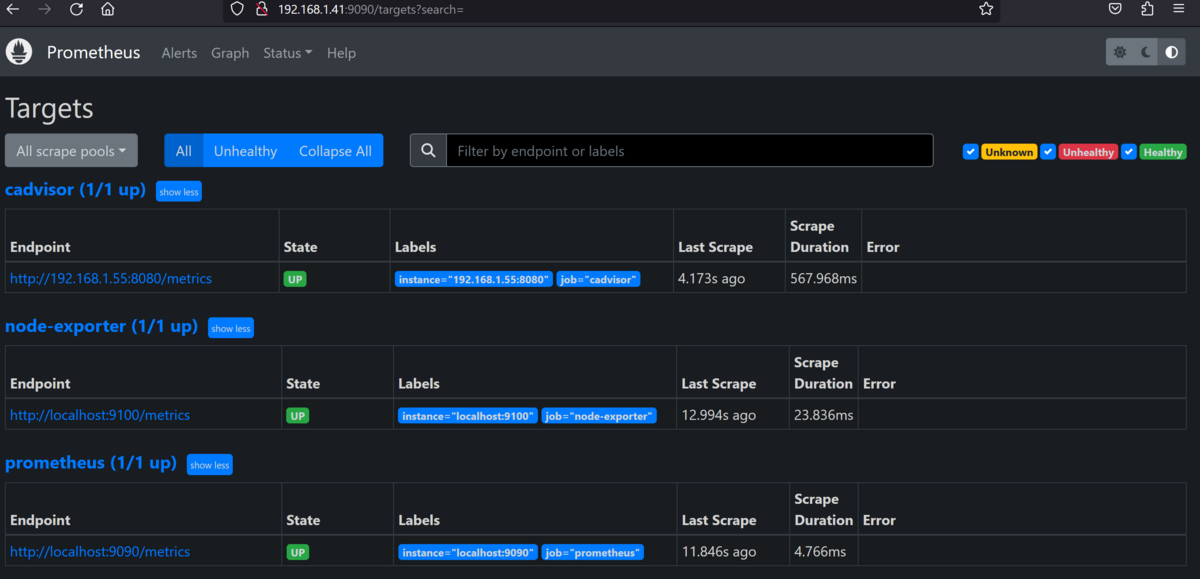
PrometheusのWebUIへのアクセスは、
Prometheusが起動しているIPアドレスのTCP9090へブラウザからアクセスします。
http://IPアドレス:9090へアクセスすると、以下の画面が表示されます。
http://IPアドレス:9090/targetsへアクセスすると、
データ収集先の一覧が表示されます。
②Node-Exporterの導入
続いて、Linuxホストのデータを公開してくれるNode-Exporterの導入です。
まず、ファイル(圧縮されている)をダウンロードし、解凍します。
kubeuser@master01:/tmp$ wget https://github.com/prometheus/node_exporter/releases/download/v1.5.0/node_exporter-1.5.0.linux-amd64.tar.gz
--2023-05-09 06:22:35--  https://github.com/prometheus/node_exporter/releases/download/v1.5.0/node_exporter-1.5.0.linux-amd64.tar.gz
Resolving github.com (github.com)... 20.27.177.113
Connecting to github.com (github.com)|20.27.177.113|:443... connected.
HTTP request sent, awaiting response... 302 Found
Location: https://objects.githubusercontent.com/github-production-release-asset-2e65be/9524057/fc1630e0-8913-427f-94ba-4131d3ed96c7?X-Amz-Algorithm=AWS4-HMAC-SHA256&X-Amz-Credential=AKIAIWNJYAX4CSVEH53A%2F20230509%2Fus-east-1%2Fs3%2Faws4_request&X-Amz-Date=20230509T062235Z&X-Amz-Expires=300&X-Amz-Signature=86be39fe42c6bfb169c98e014867161ef5c5507c63e46e1e6ccf107ad4d5da02&X-Amz-SignedHeaders=host&actor_id=0&key_id=0&repo_id=9524057&response-content-disposition=attachment%3B%20filename%3Dnode_exporter-1.5.0.linux-amd64.tar.gz&response-content-type=application%2Foctet-stream [following]
--2023-05-09 06:22:35--  https://objects.githubusercontent.com/github-production-release-asset-2e65be/9524057/fc1630e0-8913-427f-94ba-4131d3ed96c7?X-Amz-Algorithm=AWS4-HMAC-SHA256&X-Amz-Credential=AKIAIWNJYAX4CSVEH53A%2F20230509%2Fus-east-1%2Fs3%2Faws4_request&X-Amz-Date=20230509T062235Z&X-Amz-Expires=300&X-Amz-Signature=86be39fe42c6bfb169c98e014867161ef5c5507c63e46e1e6ccf107ad4d5da02&X-Amz-SignedHeaders=host&actor_id=0&key_id=0&repo_id=9524057&response-content-disposition=attachment%3B%20filename%3Dnode_exporter-1.5.0.linux-amd64.tar.gz&response-content-type=application%2Foctet-stream
Resolving objects.githubusercontent.com (objects.githubusercontent.com)... 185.199.108.133, 185.199.109.133, 185.199.110.133, ...
Connecting to objects.githubusercontent.com (objects.githubusercontent.com)|185.199.108.133|:443... connected.
HTTP request sent, awaiting response... 200 OK
Length: 10181045 (9.7M) [application/octet-stream]
Saving to: ‘node_exporter-1.5.0.linux-amd64.tar.gz’
node_exporter-1.5.0.linux 100%[====================================>]   9.71M  11.1MB/s    in 0.9s

2023-05-09 06:22:36 (11.1 MB/s) - ‘node_exporter-1.5.0.linux-amd64.tar.gz’ saved [10181045/10181045]

kubeuser@master01: /tmp kubeuser@master01:/tmp$ ls
mnode_exporter-1.5.0.linux-amd64.tar.gz

kubeuser@master01:/tmp$ tar zxvf node_exporter-1.5.0.linux-amd64.tar.gz
node_exporter-1.5.0.linux-amd64/
node_exporter-1.5.0.linux-amd64/LICENSE
node_exporter-1.5.0.linux-amd64/NOTICE
node_exporter-1.5.0.linux-amd64/node_exporter

kubeuser@master01:/tmp$ cd node_exporter-1.5.0.linux-amd64/

kubeuser@master01:/tmp/node_exporter-1.5.0.linux-amd64$ ls
LICENSE  NOTICE  node_exporter
上記にある、node_exporterが実行ファイルです。
Prometheus同様に実行すればOKです。
kubeuser@master01:/tmp/node_exporter-1.5.0.linux-amd64$ ./node_exporter
ts=2023-05-09T06:23:03.115Z caller=node_exporter.go:180 level=info msg="Starting node_exporter" version="(version=1.5.0, branch=HEAD, revision=1b48970ffcf5630534fb00bb0687d73c66d1c959)"
ts=2023-05-09T06:23:03.115Z caller=node_exporter.go:181 level=info msg="Build context" build_context="(go=go1.19.3, user=root@6e7732a7b81b, date=20221129-18:59:09)"
ts=2023-05-09T06:23:03.115Z caller=filesystem_common.go:111 level=info collector=filesystem msg="Parsed flag --collector.filesystem.mount-points-exclude" flag=^/(dev|proc|run/credentials/.+|sys|var/lib/docker/.+|var/lib/containers/storage/.+)($|/)
ts=2023-05-09T06:23:03.115Z caller=filesystem_common.go:113 level=info collector=filesystem msg="Parsed flag --collector.filesystem.fs-types-exclude" flag=^(autofs|binfmt_misc|bpf|cgroup2?|configfs|debugfs|devpts|devtmpfs|fusectl|hugetlbfs|iso9660|mqueue|nsfs|overlay|proc|procfs|pstore|rpc_pipefs|securityfs|selinuxfs|squashfs|sysfs|tracefs)$
ts=2023-05-09T06:23:03.116Z caller=diskstats_common.go:111 level=info collector=diskstats msg="Parsed flag --collector.diskstats.device-exclude" flag=^(ram|loop|fd|(h|s|v|xv)d[a-z]|nvme\d+n\d+p)\d+$
ts=2023-05-09T06:23:03.117Z caller=node_exporter.go:110 level=info msg="Enabled collectors"
ts=2023-05-09T06:23:03.117Z caller=node_exporter.go:117 level=info collector=arp
ts=2023-05-09T06:23:03.117Z caller=node_exporter.go:117 level=info collector=bcache
ts=2023-05-09T06:23:03.117Z caller=node_exporter.go:117 level=info collector=bonding
ts=2023-05-09T06:23:03.117Z caller=node_exporter.go:117 level=info collector=btrfs
ts=2023-05-09T06:23:03.117Z caller=node_exporter.go:117 level=info collector=conntrack
ts=2023-05-09T06:23:03.117Z caller=node_exporter.go:117 level=info collector=cpu
ts=2023-05-09T06:23:03.117Z caller=node_exporter.go:117 level=info collector=cpufreq
ts=2023-05-09T06:23:03.117Z caller=node_exporter.go:117 level=info collector=diskstats
ts=2023-05-09T06:23:03.117Z caller=node_exporter.go:117 level=info collector=dmi
ts=2023-05-09T06:23:03.117Z caller=node_exporter.go:117 level=info collector=edac
ts=2023-05-09T06:23:03.117Z caller=node_exporter.go:117 level=info collector=entropy
ts=2023-05-09T06:23:03.117Z caller=node_exporter.go:117 level=info collector=fibrechannel
ts=2023-05-09T06:23:03.117Z caller=node_exporter.go:117 level=info collector=filefd
ts=2023-05-09T06:23:03.117Z caller=node_exporter.go:117 level=info collector=filesystem
ts=2023-05-09T06:23:03.117Z caller=node_exporter.go:117 level=info collector=hwmon
ts=2023-05-09T06:23:03.117Z caller=node_exporter.go:117 level=info collector=infiniband
ts=2023-05-09T06:23:03.117Z caller=node_exporter.go:117 level=info collector=ipvs
ts=2023-05-09T06:23:03.117Z caller=node_exporter.go:117 level=info collector=loadavg
ts=2023-05-09T06:23:03.117Z caller=node_exporter.go:117 level=info collector=mdadm
ts=2023-05-09T06:23:03.117Z caller=node_exporter.go:117 level=info collector=meminfo
ts=2023-05-09T06:23:03.117Z caller=node_exporter.go:117 level=info collector=netclass
ts=2023-05-09T06:23:03.117Z caller=node_exporter.go:117 level=info collector=netdev
ts=2023-05-09T06:23:03.117Z caller=node_exporter.go:117 level=info collector=netstat
ts=2023-05-09T06:23:03.117Z caller=node_exporter.go:117 level=info collector=nfs
ts=2023-05-09T06:23:03.117Z caller=node_exporter.go:117 level=info collector=nfsd
ts=2023-05-09T06:23:03.117Z caller=node_exporter.go:117 level=info collector=nvme
ts=2023-05-09T06:23:03.117Z caller=node_exporter.go:117 level=info collector=os
ts=2023-05-09T06:23:03.117Z caller=node_exporter.go:117 level=info collector=powersupplyclass
ts=2023-05-09T06:23:03.117Z caller=node_exporter.go:117 level=info collector=pressure
ts=2023-05-09T06:23:03.117Z caller=node_exporter.go:117 level=info collector=rapl
ts=2023-05-09T06:23:03.117Z caller=node_exporter.go:117 level=info collector=schedstat
ts=2023-05-09T06:23:03.117Z caller=node_exporter.go:117 level=info collector=selinux
ts=2023-05-09T06:23:03.117Z caller=node_exporter.go:117 level=info collector=sockstat
ts=2023-05-09T06:23:03.117Z caller=node_exporter.go:117 level=info collector=softnet
ts=2023-05-09T06:23:03.117Z caller=node_exporter.go:117 level=info collector=stat
ts=2023-05-09T06:23:03.117Z caller=node_exporter.go:117 level=info collector=tapestats
ts=2023-05-09T06:23:03.118Z caller=node_exporter.go:117 level=info collector=textfile
ts=2023-05-09T06:23:03.118Z caller=node_exporter.go:117 level=info collector=thermal_zone
ts=2023-05-09T06:23:03.118Z caller=node_exporter.go:117 level=info collector=time
ts=2023-05-09T06:23:03.118Z caller=node_exporter.go:117 level=info collector=timex
ts=2023-05-09T06:23:03.118Z caller=node_exporter.go:117 level=info collector=udp_queues
ts=2023-05-09T06:23:03.118Z caller=node_exporter.go:117 level=info collector=uname
ts=2023-05-09T06:23:03.118Z caller=node_exporter.go:117 level=info collector=vmstat
ts=2023-05-09T06:23:03.118Z caller=node_exporter.go:117 level=info collector=xfs
ts=2023-05-09T06:23:03.118Z caller=node_exporter.go:117 level=info collector=zfs
ts=2023-05-09T06:23:03.118Z caller=tls_config.go:232 level=info msg="Listening on" address=[::]:9100
ts=2023-05-09T06:23:03.118Z caller=tls_config.go:235 level=info msg="TLS is disabled." http2=false address=[::]:9100
もちろん、nohup経由で実行でも大丈夫です。
kubeuser@master01:/tmp/node_exporter-1.5.0.linux-amd64$ nohup ./node_exporter > /dev/null 2>&1 &
③cAdvisorの導入
次は、Dockerやkubernetesのコンテナに関するリソースデータ(CPU・メモリーなど)を公開してくれるExporterのcAdivisorの導入です。
導入方法はいくつかあるのですが、今回はkubernetesのdaemonsetsとして導入します。
※導入で使用するkustomizeはkubernetes構築でインストールしたkubectlがあれば使えます。
cAdvisorについて
https://github.com/google/cadvisor
cAdvisorのリリース情報
https://github.com/google/cadvisor/releases
cAdvisorのdaemonsetsとしての導入方法
https://github.com/google/cadvisor/tree/master/deploy/kubernetes
まず、cAdvisorの最新Gitをクローンします。
kubeuser@master01:/tmp/$ git clone https://github.com/google/cadvisor.git

kubeuser@master01:/tmp$ ls
cadvisor

kubeuser@master01:/tmp$ cd cadvisor/

kubeuser@master01:/tmp/cadvisor$ ls
AUTHORS          LICENSE    build   cmd        deploy        docs    go.mod  integration  manager  perf     storage        test.htpasswd  validate  zfs
CHANGELOG.md     Makefile   cache   collector  devicemapper  events  go.sum  logo.png     metrics  resctrl  summary        third_party    version
CONTRIBUTING.md  README.md  client  container  doc.go        fs      info    machine      nvm      stats    test.htdigest  utils          watcher
kubectl kustomize deploy/kubernetes/baseを実行すると、
そのディレクトリから構成されるyamlファイルの内容が出力されます。
※gitクローンした中にある/deploy/kubernetes/base/daemonset.yamlの内容
この中で、バージョンだけ現時点での最新バージョンとなる0.47.0へ修正します。
kubeuser@master01:/tmp/cadvisor$ kubectl kustomize deploy/kubernetes/base
apiVersion: v1
kind: Namespace
metadata:
  labels:
    app: cadvisor
  name: cadvisor
---
apiVersion: v1
kind: ServiceAccount
metadata:
  labels:
    app: cadvisor
  name: cadvisor
  namespace: cadvisor
---
apiVersion: apps/v1
kind: DaemonSet
metadata:
  annotations:
    seccomp.security.alpha.kubernetes.io/pod: docker/default
  labels:
    app: cadvisor
  name: cadvisor
  namespace: cadvisor
spec:
  selector:
    matchLabels:
      app: cadvisor
      name: cadvisor
  template:
    metadata:
      labels:
        app: cadvisor
        name: cadvisor
    spec:
      automountServiceAccountToken: false
      containers:
      - image: gcr.io/cadvisor/cadvisor:v0.45.0
        name: cadvisor
        ports:
        - containerPort: 8080
          name: http
          protocol: TCP
        resources:
          limits:
            cpu: 800m
            memory: 2000Mi
          requests:
            cpu: 400m
            memory: 400Mi
        volumeMounts:
        - mountPath: /rootfs
          name: rootfs
          readOnly: true
        - mountPath: /var/run
          name: var-run
          readOnly: true
        - mountPath: /sys
          name: sys
          readOnly: true
        - mountPath: /var/lib/docker
          name: docker
          readOnly: true
        - mountPath: /dev/disk
          name: disk
          readOnly: true
      serviceAccountName: cadvisor
      terminationGracePeriodSeconds: 30
      volumes:
      - hostPath:
          path: /
        name: rootfs
      - hostPath:
          path: /var/run
        name: var-run
      - hostPath:
          path: /sys
        name: sys
      - hostPath:
          path: /var/lib/docker
        name: docker
      - hostPath:
          path: /dev/disk
        name: disk
修正方法は、以下のファイルをエディタなどで変更すればOKです。
kubeuser@master01:/tmp/cadvisor$ cat ./deploy/kubernetes/base/daemonset.yaml
apiVersion: apps/v1 # for Kubernetes versions before 1.9.0 use apps/v1beta2
kind: DaemonSet
metadata:
  name: cadvisor
  namespace: cadvisor
  annotations:
      seccomp.security.alpha.kubernetes.io/pod: 'docker/default'
spec:
  selector:
    matchLabels:
      name: cadvisor
  template:
    metadata:
      labels:
        name: cadvisor
    spec:
      serviceAccountName: cadvisor
      containers:
      - name: cadvisor
        image: gcr.io/cadvisor/cadvisor:v0.47.0
        resources:
          requests:
            memory: 400Mi
            cpu: 400m
          limits:
            memory: 2000Mi
            cpu: 800m
        volumeMounts:
        - name: rootfs
          mountPath: /rootfs
          readOnly: true
        - name: var-run
          mountPath: /var/run
          readOnly: true
        - name: sys
          mountPath: /sys
          readOnly: true
        - name: docker
          mountPath: /var/lib/docker
          readOnly: true
        - name: disk
          mountPath: /dev/disk
          readOnly: true
        ports:
          - name: http
            containerPort: 8080
            protocol: TCP
      automountServiceAccountToken: false
      terminationGracePeriodSeconds: 30
      volumes:
      - name: rootfs
        hostPath:
          path: /
      - name: var-run
        hostPath:
          path: /var/run
      - name: sys
        hostPath:
          path: /sys
      - name: docker
        hostPath:
          path: /var/lib/docker
      - name: disk
        hostPath:
          path: /dev/disk
念のため、確認。
大丈夫そうですね!
kubeuser@master01:/tmp/cadvisor$ kubectl kustomize deploy/kubernetes/base
apiVersion: v1
kind: Namespace
metadata:
  labels:
    app: cadvisor
  name: cadvisor
---
apiVersion: v1
kind: ServiceAccount
metadata:
  labels:
    app: cadvisor
  name: cadvisor
  namespace: cadvisor
---
apiVersion: apps/v1
kind: DaemonSet
metadata:
  annotations:
    seccomp.security.alpha.kubernetes.io/pod: docker/default
  labels:
    app: cadvisor
  name: cadvisor
  namespace: cadvisor
spec:
  selector:
    matchLabels:
      app: cadvisor
      name: cadvisor
  template:
    metadata:
      labels:
        app: cadvisor
        name: cadvisor
    spec:
      automountServiceAccountToken: false
      containers:
      - image: gcr.io/cadvisor/cadvisor:v0.47.0
        name: cadvisor
        ports:
        - containerPort: 8080
          name: http
          protocol: TCP
        resources:
          limits:
            cpu: 800m
            memory: 2000Mi
          requests:
            cpu: 400m
            memory: 400Mi
        volumeMounts:
        - mountPath: /rootfs
          name: rootfs
          readOnly: true
        - mountPath: /var/run
          name: var-run
          readOnly: true
        - mountPath: /sys
          name: sys
          readOnly: true
        - mountPath: /var/lib/docker
          name: docker
          readOnly: true
        - mountPath: /dev/disk
          name: disk
          readOnly: true
      serviceAccountName: cadvisor
      terminationGracePeriodSeconds: 30
      volumes:
      - hostPath:
          path: /
        name: rootfs
      - hostPath:
          path: /var/run
        name: var-run
      - hostPath:
          path: /sys
        name: sys
      - hostPath:
          path: /var/lib/docker
        name: docker
      - hostPath:
          path: /dev/disk
        name: disk
あとは、kubectlを使ってそのyamlを適用(apply)します。
Daemonset(Pod)とSserviceAccountが作成されます。
kubeuser@master01:/tmp/cadvisor$ kubectl kustomize deploy/kubernetes/base | kubectl apply -f -

kubeuser@master01:/tmp/cadvisor$ kubectl get all -n cadvisor
NAME                 READY   STATUS    RESTARTS   AGE
pod/cadvisor-kd9wj   1/1     Running   0          15h
pod/cadvisor-sz9mn   1/1     Running   0          15h

NAME               TYPE           CLUSTER-IP   EXTERNAL-IP                        PORT(S)          AGE
service/cadvisor   LoadBalancer   10.1.4.84    192.168.1.55,240f:32:57b8:1::1:1   8080:32087/TCP   14h

NAME                      DESIRED   CURRENT   READY   UP-TO-DATE   AVAILABLE   NODE SELECTOR   AGE
daemonset.apps/cadvisor   2         2         2       2            2           <none>          15h

kubeuser@master01:/tmp/cadvisor$ kubectl get sa -n cadvisor
NAME       SECRETS   AGE
cadvisor   0         15h
default    0         15h
なお、起動したコンテナ(daemonset経由で起動したpod)はkubernetesの内部ネットワークにいて外部からアクセスできないので、
Serviceリソース(今回は、type:LoadBalancer)を作成し外部(Prometheus)からアクセスできるようします。
※詳細を知りたい方は、こちらを参照ください。
kubeuser@master01:~$ cat svc_cadvisor.yaml
apiVersion: v1
kind: Service
metadata:
  labels:
    app: cadvisor
  name: cadvisor
  namespace: cadvisor
spec:
  ipFamilies:
  - IPv4
  - IPv6
  ipFamilyPolicy: RequireDualStack
  ports:
  - port: 8080
    protocol: TCP
    targetPort: 8080
  selector:
    app: cadvisor
  type: LoadBalancer

kubeuser@master01:~$ kubectl apply -f svc_cadvisor.yaml

kubeuser@master01:~$ kubectl get svc -n cadvisor
NAME       TYPE           CLUSTER-IP   EXTERNAL-IP                        PORT(S)          AGE
cadvisor   LoadBalancer   10.1.4.84    192.168.1.55,240f:32:57b8:1::1:1   8080:32087/TCP   15h
※prometheusの設定ファイルに記述したIPアドレスと一致している必要があります。
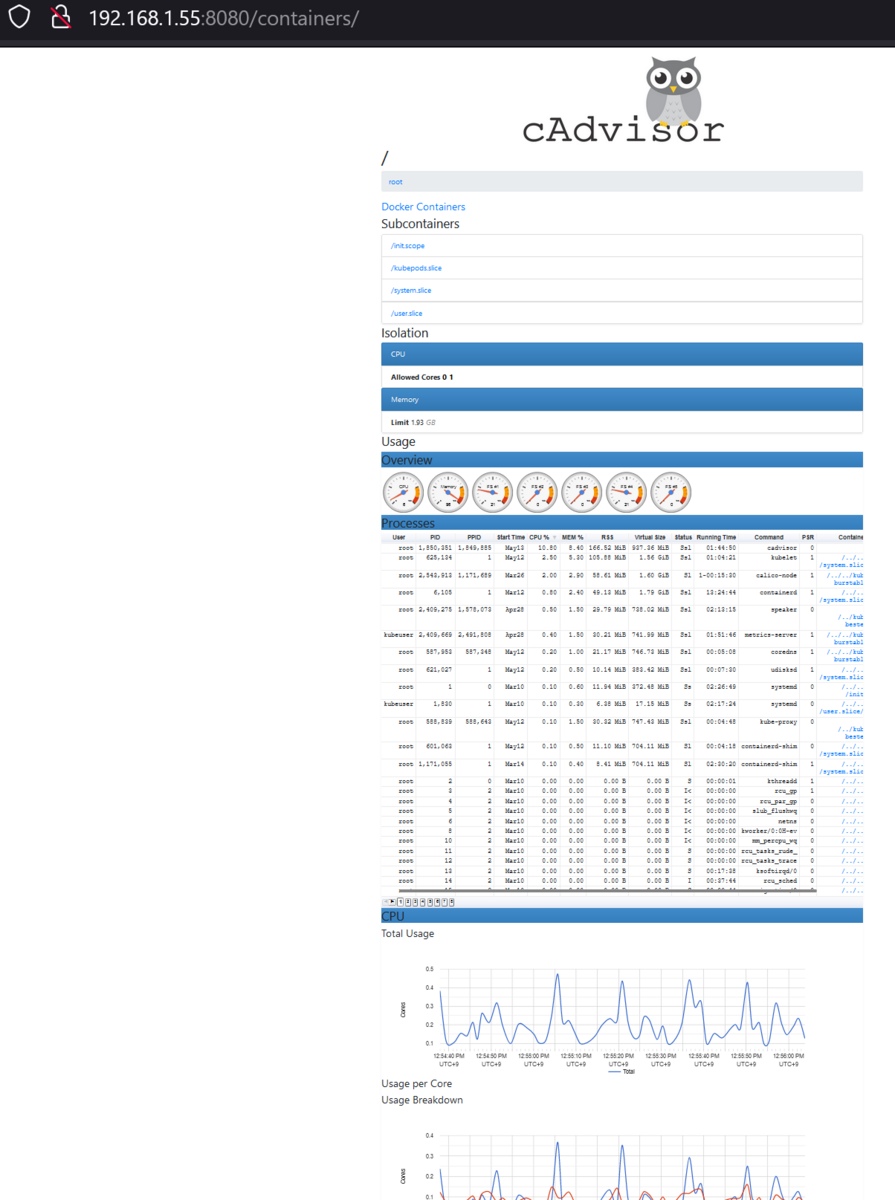
公開したIPアドレス&ポート番号TCP8080へブラウザからアクセスすると、
以下のようにcAdvisor単体でも情報を確認することができます。
④Grafanaの導入
最後はGrafanaの導入です。
なお、debianパッケージからインストールするので、
予め依存関係にあるパッケージをインストールしておきます。
kubeuser@master01:/tmp$ sudo apt install adduser libfontconfig1

kubeuser@master01:/tmp$ wget https://dl.grafana.com/enterprise/release/grafana-enterprise_9.5.1_amd64.deb

kubeuser@master01:/tmp$ sudo dpkg -i grafana-enterprise_9.5.1_amd64.deb
Selecting previously unselected package grafana-enterprise.
(Reading database ... 109734 files and directories currently installed.)
Preparing to unpack grafana-enterprise_9.5.1_amd64.deb ...
Unpacking grafana-enterprise (9.5.1) ...
Setting up grafana-enterprise (9.5.1) ...
Adding system user `grafana' (UID 114) ...
Adding new user `grafana' (UID 114) with group `grafana' ...
Not creating home directory `/usr/share/grafana'.
### NOT starting on installation, please execute the following statements to configure grafana to start automatically using systemd
 sudo /bin/systemctl daemon-reload
 sudo /bin/systemctl enable grafana-server
### You can start grafana-server by executing
 sudo /bin/systemctl start grafana-server
インストールしたら、systemctlから起動します。
kubeuser@master01:/tmp$ sudo systemctl start grafana-server

kubeuser@master01:~$ systemctl status grafana-server.service
● grafana-server.service - Grafana instance
     Loaded: loaded (/lib/systemd/system/grafana-server.service; disabled; vendor preset: enabled)
     Active: active (running) since Tue 2023-05-09 06:33:17 UTC; 4 days ago
       Docs: http://docs.grafana.org
   Main PID: 1945813 (grafana)
      Tasks: 16 (limit: 4572)
     Memory: 77.1M
        CPU: 7min 33.705s
     CGroup: /system.slice/grafana-server.service
             └─1945813 /usr/share/grafana/bin/grafana server --config=/etc/grafana/grafana.ini --pidfile=/run/grafana/grafana-server.pid --packaging=deb cfg:default.pa>

May 14 03:35:21 master01 grafana[1945813]: logger=licensing t=2023-05-14T03:35:21.166174587Z level=info msg="Validated license token" appURL=http://localhost:3000/ sou>
May 14 03:35:21 master01 grafana[1945813]: logger=licensing.renewal t=2023-05-14T03:35:21.166597663Z level=warn msg="failed to load or validate token" err="license tok>
May 14 03:35:21 master01 grafana[1945813]: logger=grafana.update.checker t=2023-05-14T03:35:21.264356154Z level=info msg="Update check succeeded" duration=27.251127ms
May 14 03:35:21 master01 grafana[1945813]: logger=plugins.update.checker t=2023-05-14T03:35:21.565418771Z level=info msg="Update check succeeded" duration=178.364416ms
May 14 03:45:21 master01 grafana[1945813]: logger=cleanup t=2023-05-14T03:45:21.021219956Z level=info msg="Completed cleanup jobs" duration=55.055014ms
May 14 03:45:21 master01 grafana[1945813]: logger=grafana.update.checker t=2023-05-14T03:45:21.259656472Z level=info msg="Update check succeeded" duration=22.394717ms
May 14 03:45:21 master01 grafana[1945813]: logger=plugins.update.checker t=2023-05-14T03:45:21.605664059Z level=info msg="Update check succeeded" duration=217.921627ms
May 14 03:55:21 master01 grafana[1945813]: logger=cleanup t=2023-05-14T03:55:21.061734326Z level=info msg="Completed cleanup jobs" duration=96.134508ms
May 14 03:55:21 master01 grafana[1945813]: logger=grafana.update.checker t=2023-05-14T03:55:21.269038096Z level=info msg="Update check succeeded" duration=31.282589ms
May 14 03:55:21 master01 grafana[1945813]: logger=plugins.update.checker t=2023-05-14T03:55:21.606702747Z level=info msg="Update check succeeded" duration=219.362429ms

kubeuser@master01:~$ sudo systemctl enable grafana-server
[sudo] password for kubeuser:
Synchronizing state of grafana-server.service with SysV service script with /lib/systemd/systemd-sysv-install.
Executing: /lib/systemd/systemd-sysv-install enable grafana-server
Created symlink /etc/systemd/system/multi-user.target.wants/grafana-server.service → /lib/systemd/system/grafana-server.service.

kubeuser@master01:~$ systemctl is-enabled grafana-server
enabled
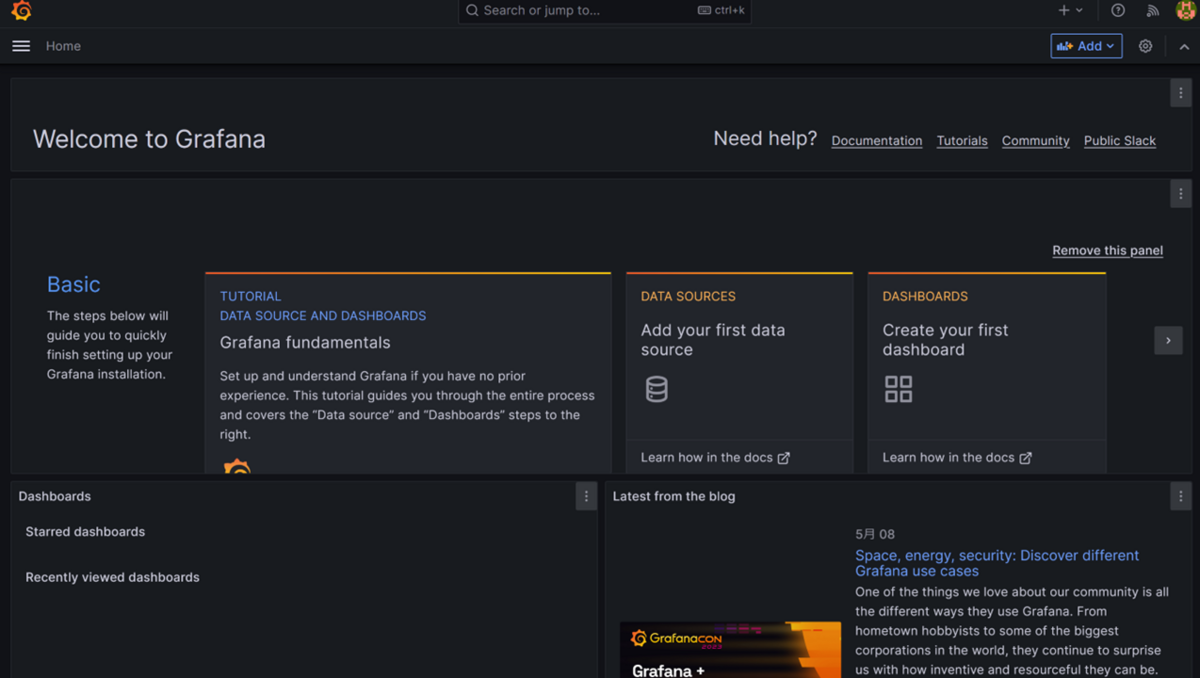
インストール後、ブラウザからTCP3000番へアクセスすると、
Grafanaが利用できます。
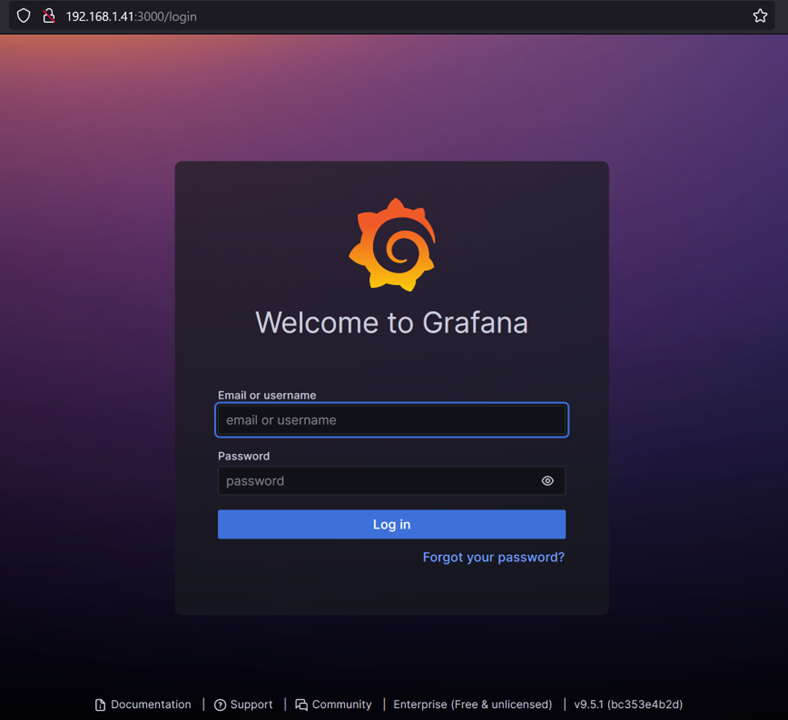
ユーザ名:admin、初期パスワード:adminでログインし、
パスワード変更したらホーム画面が表示されます。

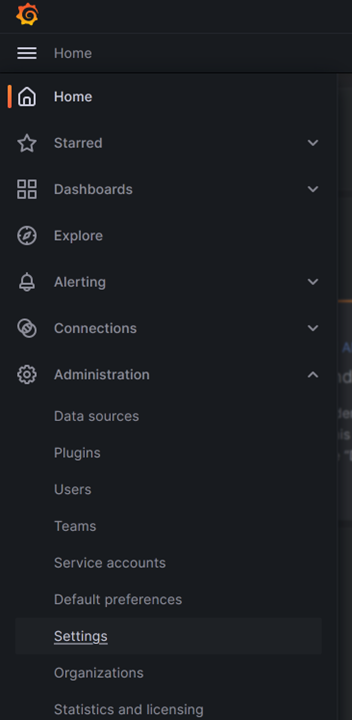
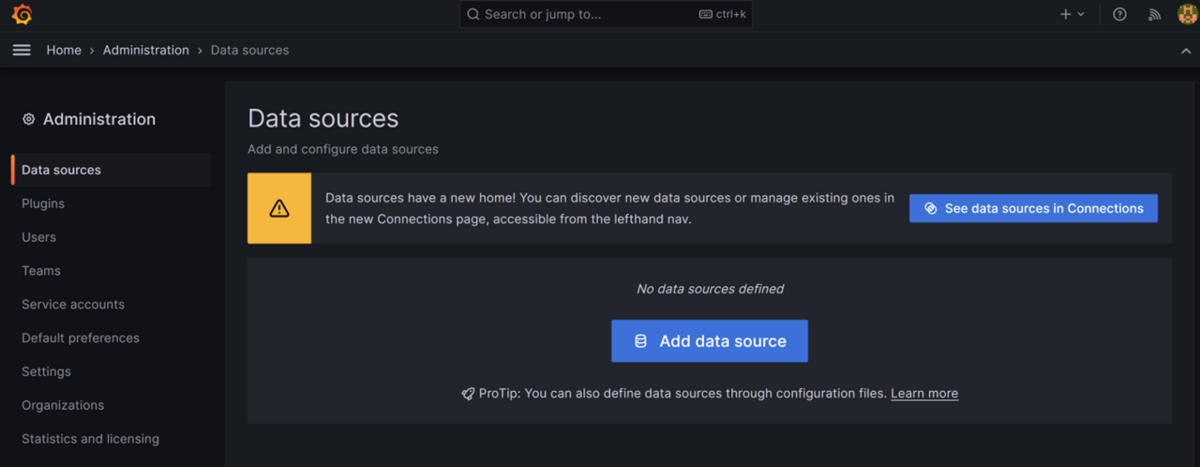
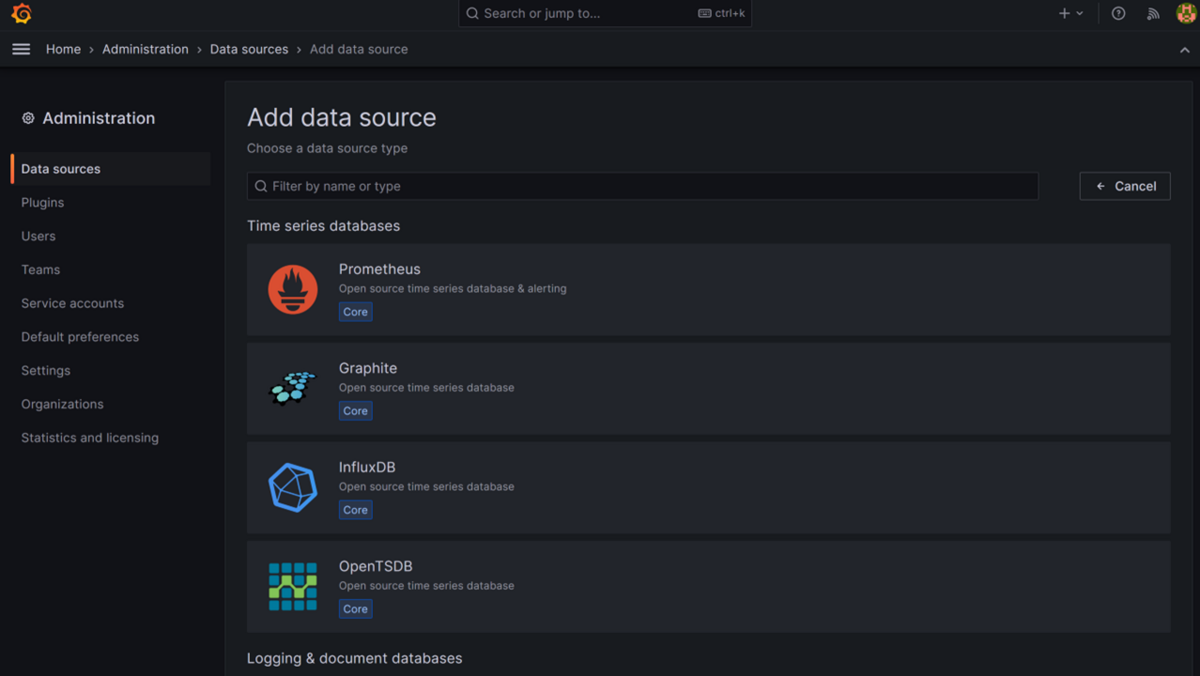
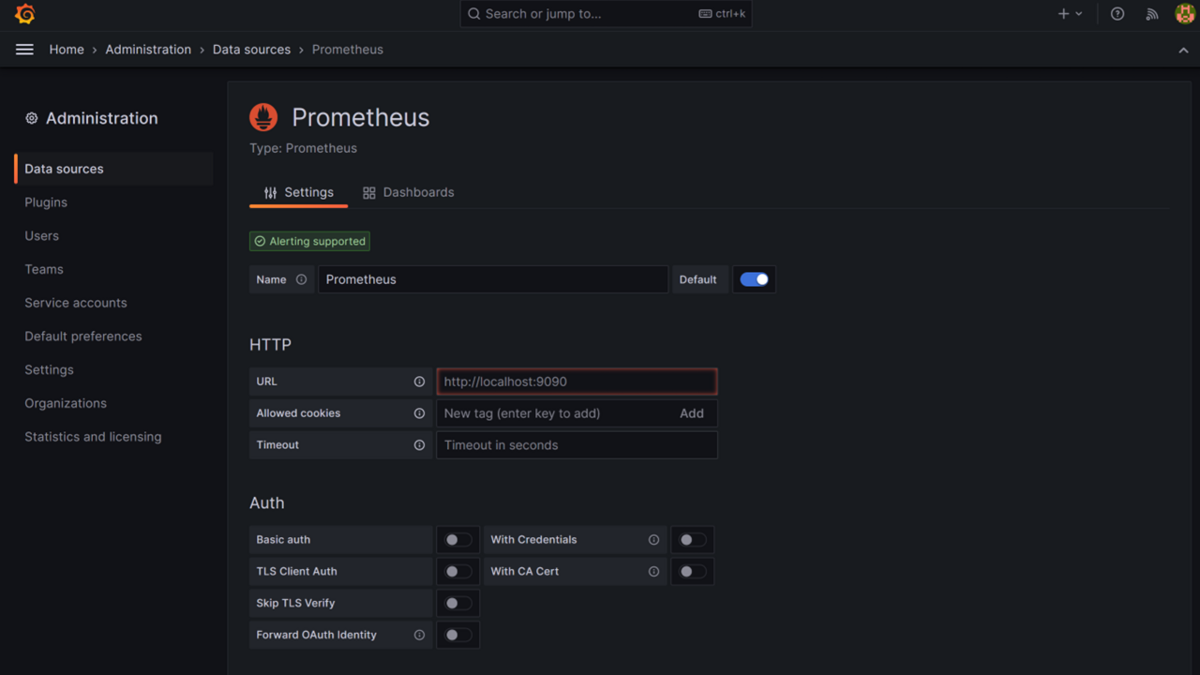
Prometheusとの連携ですが、
Home > Administration > Data sourcesで行います。
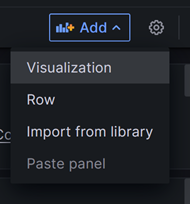
グラフの追加は、右上にあるAdd > Visualizationで行います。
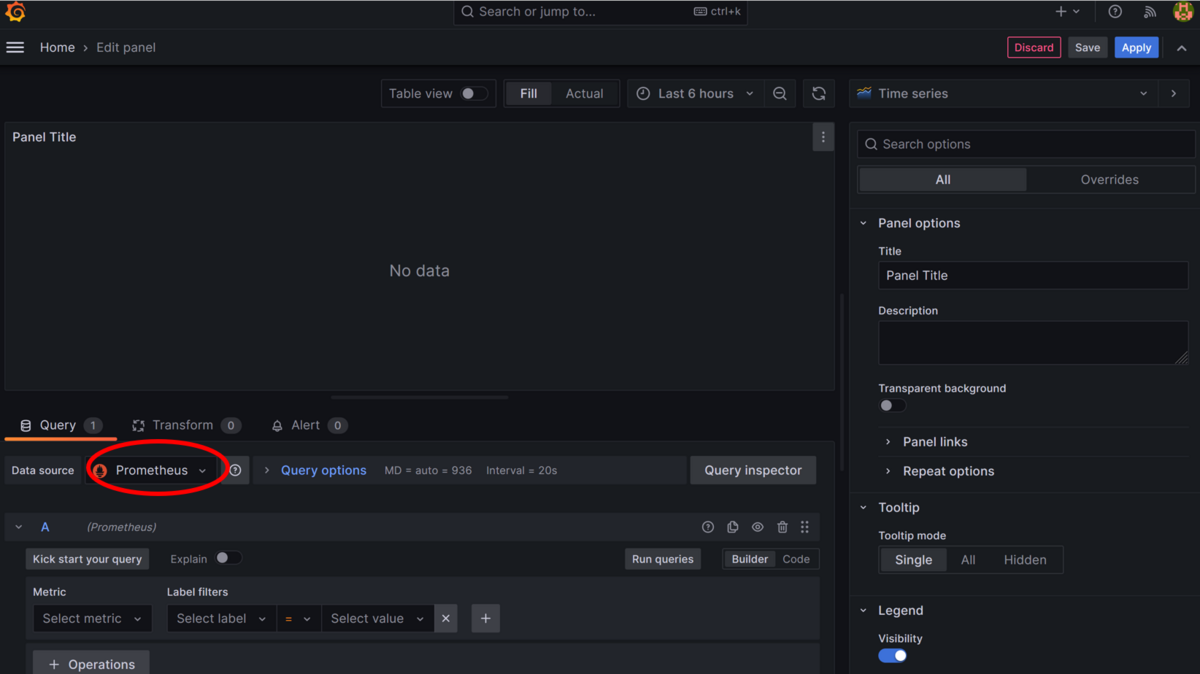
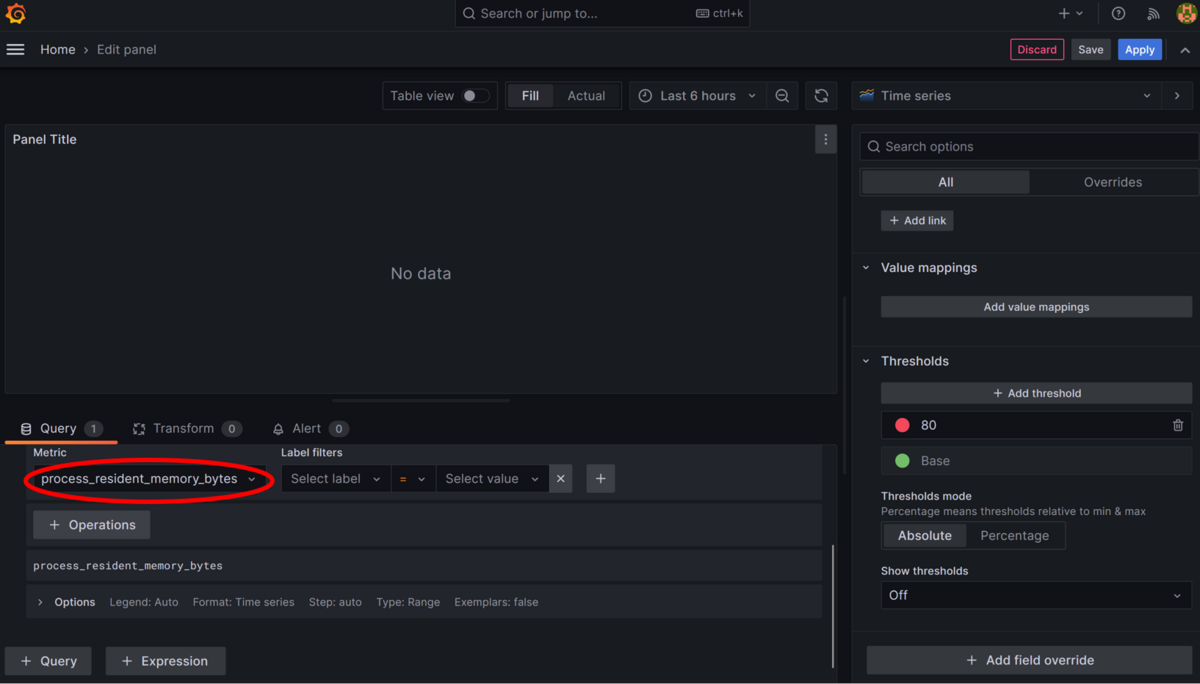
そして、Data Source:Prometheus、Metric:監視したいデータ としてグラフで表示するデータを選択し、Apply(Dashboardへのグラフの適用)します。
※Save(Dashboardの保存)もしておきましょう。
※グラフの見せ方もカスタマイズ可能です。
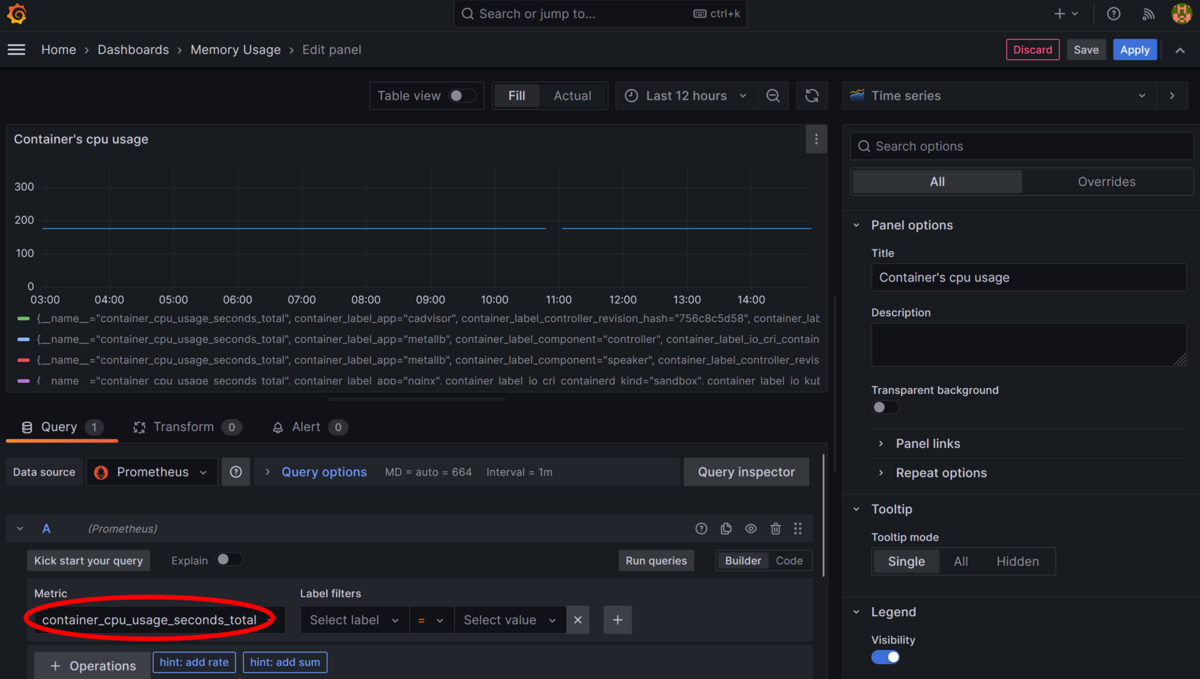
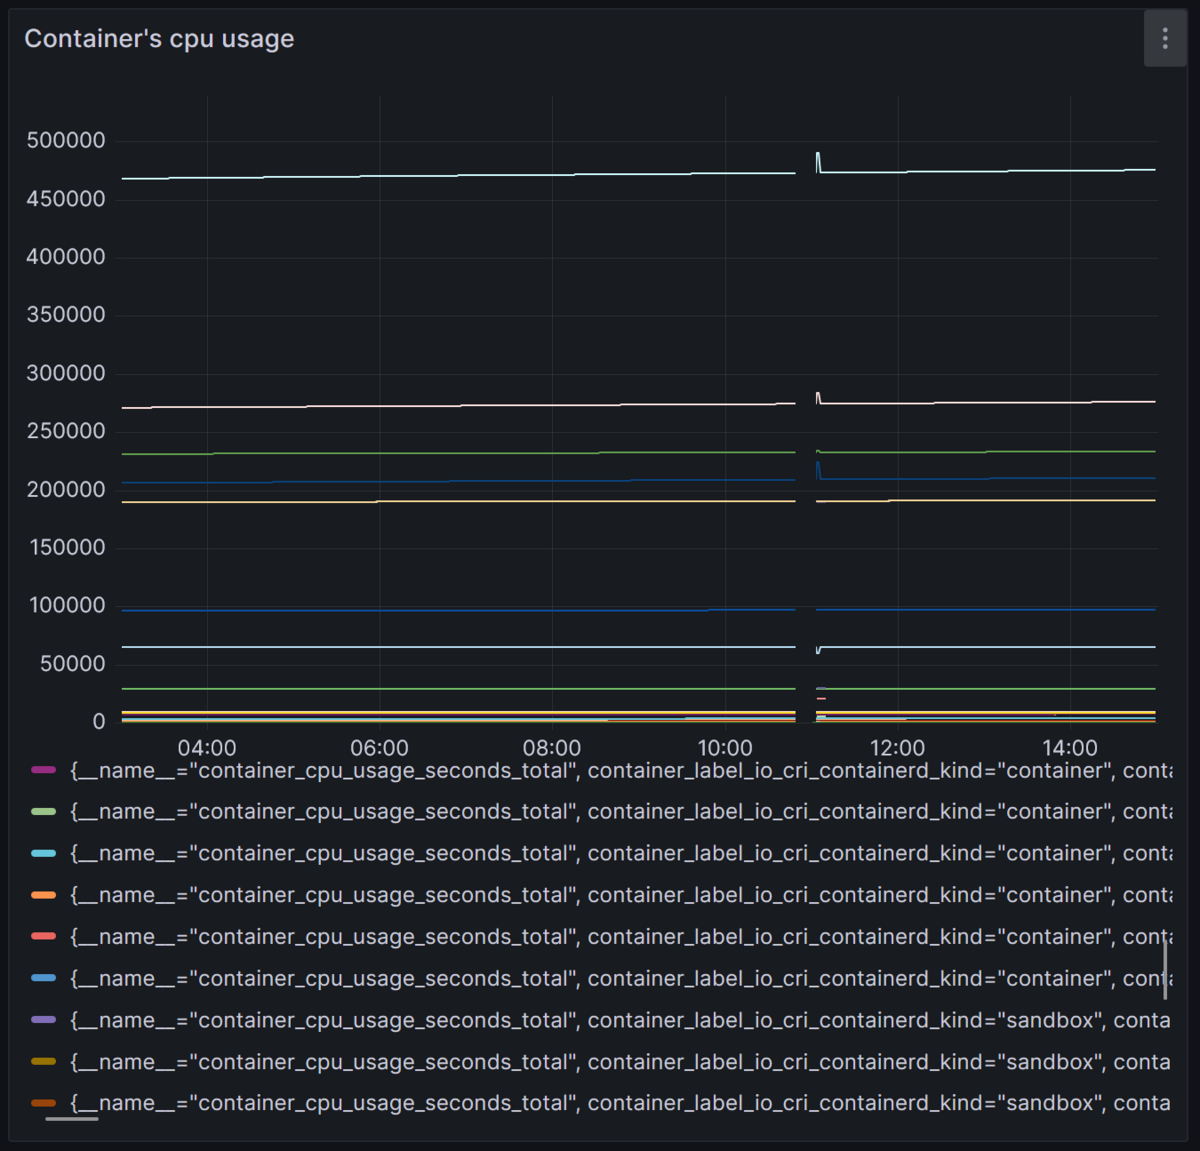
コンテナデータをグラフ化したい場合は、以下のようにcontainer_xxxxとなっているMetric(cAdvisorが公開している)を選択すればOKです。
※特定のコンテナだけを表示させたい場合は、下部にある凡例のコンテナをクリックすればいい。
おわりに
今回、Prometheus・Grafana・Node-Exporter・cAdvisorを使って監視の仕組みを試してみました。
手間はかかるものの、完成したときの達成感はいいですね♪
・それぞれのソフトウェアの役割の理解
・それらがどのように連携しているかの理解
・監視したい情報は、どのExporterで取得できるのか
・Exporterから提供される各Metricの意味の理解
・見やすいグラフにするにはどうすればいいか
などもっと掘り下げないといけない部分はあるかなと思いますが、
基本的な部分はある程度理解ができたように思います。