LinuCエヴァンジェリストの鯨井貴博@opensourcetechです。
はじめに
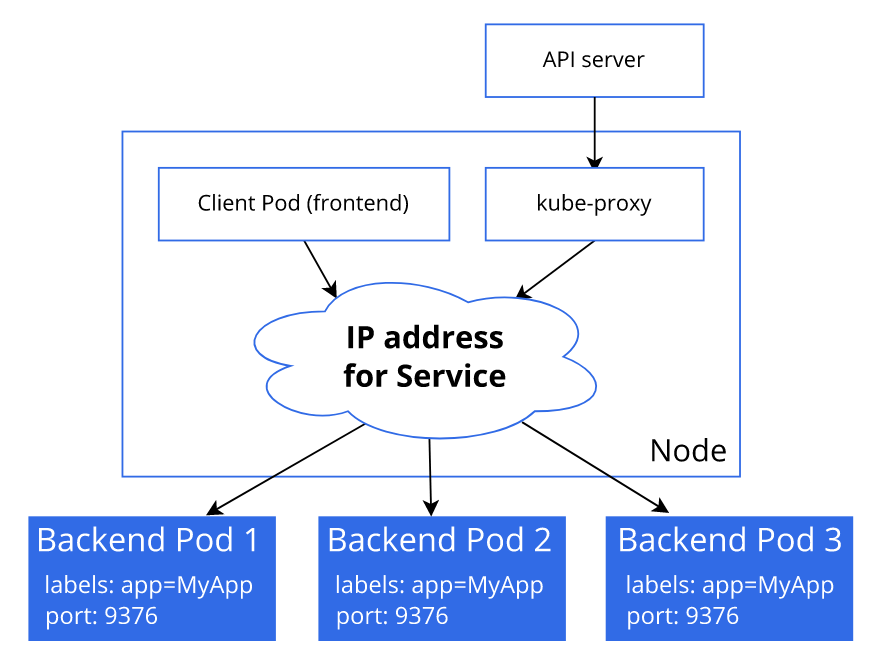
前回(kubernetesにおけるPodへの負荷分散状況の確認(Service/Deployment経由))の記事でトラフィックの分散をkube-proxyが担っていることが分かりました。
なので今回さらに深堀りということで、kube-proxyの動作モードをデフォルト(iptables)からipvsに変更してトラフィック分散の挙動を確認してみようと思います。
なお、kubernetesはこちらの記事で作ったものを使っています。
kube-proxy動作モードの確認
まず、特にモード指定せずにインストールしたkubernetes環境でkube-proxyのモードを確認します。
kube-proxy(pod)のログからiptablesモードで動いていることが分かります。
I0314 13:48:24.900100 1 server_others.go:535] "Using iptables proxy"
I0314 13:48:24.931674 1 server_others.go:176] "Using iptables Proxier"
kubeuser@master01:~$ kubectl get pods -n kube-system
NAME                                      READY   STATUS    RESTARTS   AGE
calico-kube-controllers-57b57c56f-p6xds   1/1     Running   0          12d
calico-node-phmkb                         1/1     Running   0          12d
calico-node-wjdqx                         1/1     Running   0          12d
calico-node-xdkfv                         1/1     Running   0          12d
coredns-787d4945fb-6n79l                  1/1     Running   0          12d
coredns-787d4945fb-dfplr                  1/1     Running   0          12d
etcd-master01                             1/1     Running   3          12d
kube-apiserver-master01                   1/1     Running   2          12d
kube-controller-manager-master01          1/1     Running   0          12d
kube-proxy-2n7b2                          1/1     Running   0          12d
kube-proxy-7k425                          1/1     Running   0          12d
kube-proxy-c5pkt                          1/1     Running   0          12d
kube-scheduler-master01                   1/1     Running   3          12d
metrics-server-6b6f9ccc7-qmtb9            1/1     Running   0          130m

kubeuser@master01:~$ kubectl logs kube-proxy-2n7b2 -n kube-system
I0314 13:48:24.898834       1 node.go:163] Successfully retrieved node IP: 192.168.1.45
I0314 13:48:24.899245       1 server_others.go:109] "Detected node IP" address="192.168.1.45"
I0314 13:48:24.900100       1 server_others.go:535] "Using iptables proxy"
I0314 13:48:24.931674       1 server_others.go:176] "Using iptables Proxier"
I0314 13:48:24.931939       1 server_others.go:183] "kube-proxy running in dual-stack mode" ipFamily=IPv4
I0314 13:48:24.932054       1 server_others.go:184] "Creating dualStackProxier for iptables"
I0314 13:48:24.932195       1 proxier.go:242] "Setting route_localnet=1 to allow node-ports on localhost; to change this either disable iptables.localhostNodePorts (--iptables-localhost-nodeports) or set nodePortAddresses (--nodeport-addresses) to filter loopback addresses"
I0314 13:48:25.005296       1 server.go:655] "Version info" version="v1.26.0"
I0314 13:48:25.005692       1 server.go:657] "Golang settings" GOGC="" GOMAXPROCS="" GOTRACEBACK=""
I0314 13:48:25.009442       1 conntrack.go:52] "Setting nf_conntrack_max" nf_conntrack_max=131072
I0314 13:48:25.012672       1 config.go:317] "Starting service config controller"
I0314 13:48:25.012821       1 shared_informer.go:273] Waiting for caches to sync for service config
I0314 13:48:25.012983       1 config.go:226] "Starting endpoint slice config controller"
I0314 13:48:25.013049       1 shared_informer.go:273] Waiting for caches to sync for endpoint slice config
I0314 13:48:25.014118       1 config.go:444] "Starting node config controller"
I0314 13:48:25.014369       1 shared_informer.go:273] Waiting for caches to sync for node config
I0314 13:48:25.198054       1 shared_informer.go:280] Caches are synced for service config
I0314 13:48:25.198100       1 shared_informer.go:280] Caches are synced for endpoint slice config
I0314 13:48:25.199072       1 shared_informer.go:280] Caches are synced for node config
E0316 23:45:26.858242       1 service_health.go:141] "Failed to start healthcheck" err="listen tcp :31402: bind: address already in use" node="worker01" service="ingress-nginx/ingress-nginx-controller" port=31402
E0316 23:45:26.922288       1 service_health.go:141] "Failed to start healthcheck" err="listen tcp :31402: bind: address already in use" node="worker01" service="ingress-nginx/ingress-nginx-controller" port=31402
E0316 23:45:27.838639       1 event_broadcaster.go:253] Server rejected event '&v1.Event{TypeMeta:v1.TypeMeta{Kind:"", APIVersion:""}, ObjectMeta:v1.ObjectMeta{Name:"ingress-nginx-controller.174d0afedb1b6a4c", GenerateName:"", Namespace:"ingress-nginx", SelfLink:"", UID:"", ResourceVersion:"", Generation:0, CreationTimestamp:time.Date(1, time.January, 1, 0, 0, 0, 0, time.UTC), DeletionTimestamp:<nil>, DeletionGracePeriodSeconds:(*int64)(nil), Labels:map[string]string(nil), Annotations:map[string]string(nil), OwnerReferences:[]v1.OwnerReference(nil), Finalizers:[]string(nil), ManagedFields:[]v1.ManagedFieldsEntry(nil)}, EventTime:time.Date(2023, time.March, 16, 23, 45, 25, 793025688, time.Local), Series:(*v1.EventSeries)(0xc00014d7c0), ReportingController:"kube-proxy", ReportingInstance:"kube-proxy-worker01", Action:"Listen", Reason:"FailedToStartServiceHealthcheck", Regarding:v1.ObjectReference{Kind:"Service", Namespace:"ingress-nginx", Name:"ingress-nginx-controller", UID:"ingress-nginx/ingress-nginx-controller", APIVersion:"", ResourceVersion:"", FieldPath:""}, Related:(*v1.ObjectReference)(nil), Note:"node worker01 failed to start healthcheck \"ingress-
.
.
.
.
また、podの設定としては/var/lib/kube-proxy/config.conf、
mode: ""とある部分でデフォルトのiptablesモードとなっていることが分かります。
kubeuser@master01:~$ kubectl describe pods kube-proxy-2n7b2 -n kube-system
Name:                 kube-proxy-2n7b2
Namespace:            kube-system
Priority:             2000001000
Priority Class Name:  system-node-critical
Service Account:      kube-proxy
Node:                 worker01/192.168.1.45
Start Time:           Tue, 14 Mar 2023 13:48:20 +0000
Labels:               controller-revision-hash=78545cdb7d
                      k8s-app=kube-proxy
                      pod-template-generation=1
Annotations:          <none>
Status:               Running
IP:                   192.168.1.45
IPs:
  IP:           192.168.1.45
Controlled By:  DaemonSet/kube-proxy
Containers:
  kube-proxy:
    Container ID:  containerd://ed9b81bf010560e2f3175dfd4f1e0415f8bc32ab57b4d2beb15822a66c31c6f0
    Image:         registry.k8s.io/kube-proxy:v1.26.0
    Image ID:      registry.k8s.io/kube-proxy@sha256:1e9bbe429e4e2b2ad32681c91deb98a334f1bf4135137df5f84f9d03689060fe
    Port:          <none>
    Host Port:     <none>
    Command:
      /usr/local/bin/kube-proxy
      --config=/var/lib/kube-proxy/config.conf
      --hostname-override=$(NODE_NAME)
    State:          Running
      Started:      Tue, 14 Mar 2023 13:48:22 +0000
    Ready:          True
    Restart Count:  0
    Environment:
      NODE_NAME:   (v1:spec.nodeName)
    Mounts:
      /lib/modules from lib-modules (ro)
      /run/xtables.lock from xtables-lock (rw)
      /var/lib/kube-proxy from kube-proxy (rw)
      /var/run/secrets/kubernetes.io/serviceaccount from kube-api-access-44qpn (ro)
Conditions:
  Type              Status
  Initialized       True
  Ready             True
  ContainersReady   True
  PodScheduled      True
Volumes:
  kube-proxy:
    Type:      ConfigMap (a volume populated by a ConfigMap)
    Name:      kube-proxy
    Optional:  false
  xtables-lock:
    Type:          HostPath (bare host directory volume)
    Path:          /run/xtables.lock
    HostPathType:  FileOrCreate
  lib-modules:
    Type:          HostPath (bare host directory volume)
    Path:          /lib/modules
    HostPathType:
  kube-api-access-44qpn:
    Type:                    Projected (a volume that contains injected data from multiple sources)
    TokenExpirationSeconds:  3607
    ConfigMapName:           kube-root-ca.crt
    ConfigMapOptional:       <nil>
    DownwardAPI:             true
QoS Class:                   BestEffort
Node-Selectors:              kubernetes.io/os=linux
Tolerations:                 op=Exists
                             node.kubernetes.io/disk-pressure:NoSchedule op=Exists
                             node.kubernetes.io/memory-pressure:NoSchedule op=Exists
                             node.kubernetes.io/network-unavailable:NoSchedule op=Exists
                             node.kubernetes.io/not-ready:NoExecute op=Exists
                             node.kubernetes.io/pid-pressure:NoSchedule op=Exists
                             node.kubernetes.io/unreachable:NoExecute op=Exists
                             node.kubernetes.io/unschedulable:NoSchedule op=Exists
Events:                      <none>


kubeuser@master01:~$ kubectl exec kube-proxy-2n7b2 -n kube-system cat /var/lib/kube-proxy/config.conf
kubectl exec [POD] [COMMAND] is DEPRECATED and will be removed in a future version. Use kubectl exec [POD] -- [COMMAND] instead.
apiVersion: kubeproxy.config.k8s.io/v1alpha1
bindAddress: 0.0.0.0
bindAddressHardFail: false
clientConnection:
  acceptContentTypes: ""
  burst: 0
  contentType: ""
  kubeconfig: /var/lib/kube-proxy/kubeconfig.conf
  qps: 0
clusterCIDR: 10.0.0.0/16,fd12:b5e0:383e::/64
configSyncPeriod: 0s
conntrack:
  maxPerCore: null
  min: null
  tcpCloseWaitTimeout: null
  tcpEstablishedTimeout: null
detectLocal:
  bridgeInterface: ""
  interfaceNamePrefix: ""
detectLocalMode: ""
enableProfiling: false
healthzBindAddress: ""
hostnameOverride: ""
iptables:
  localhostNodePorts: null
  masqueradeAll: false
  masqueradeBit: null
  minSyncPeriod: 0s
  syncPeriod: 0s
ipvs:
  excludeCIDRs: null
  minSyncPeriod: 0s
  scheduler: ""
  strictARP: false
  syncPeriod: 0s
  tcpFinTimeout: 0s
  tcpTimeout: 0s
  udpTimeout: 0s
kind: KubeProxyConfiguration
metricsBindAddress: ""
mode: ""
nodePortAddresses: null
oomScoreAdj: null
portRange: ""
showHiddenMetricsForVersion: ""
winkernel:
  enableDSR: false
  forwardHealthCheckVip: false
  networkName: ""
  rootHnsEndpointName: ""
  sourceVip: ""
kubernetesのドキュメントにも、Linuxではiptablesモードがデフォルトと書かれています。

iptablesモード
iptablesモードは、kube-proxyはバックエンドPodをランダムで選択する動きをします。

※https://kubernetes.io/ja/docs/concepts/services-networking/service/#proxy-mode-iptables
ランダムで選択とはいえ、実際にはざっくり均等になるという結果でした。
kubernetesにおけるPodへの負荷分散状況の確認(Service/Deployment経由))
ipvsモード
ipvsモードは、低いレイテンシーでトラフィックをリダイレクトする、
様々な分散方式などの特徴があります。


※https://kubernetes.io/ja/docs/concepts/services-networking/service/#proxy-mode-iptables
ipvsモード(rr:ラウンドロビン)に変更する
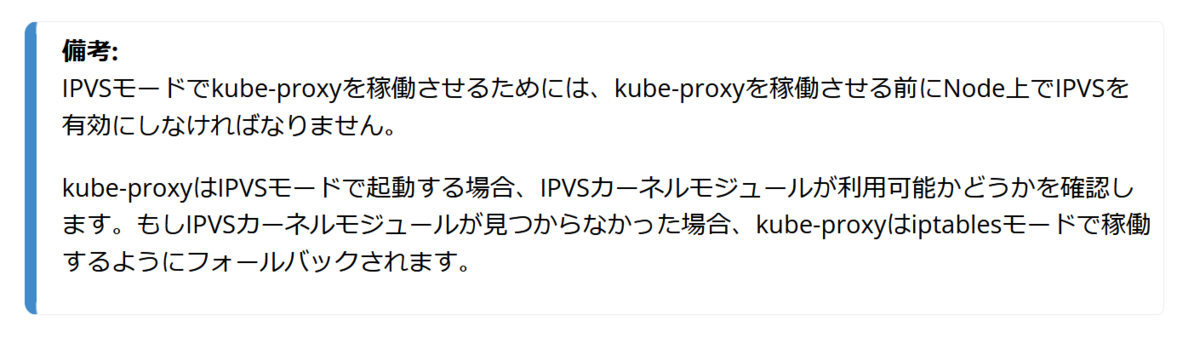
では、iptablesモードからipvsモード(rr:ラウンドロビン)に変更していきます。
まずipvsカーネルモジュールが有効になっているか確認します。
※無効な場合には、モジュールのインストールや有効化(modprobe)を実施します。
カーネルモジュールの操作については、こちらを参考にしてください。
kubeuser@master01:~$ lsmod | grep ip_vs
ip_vs_sed              16384  0
ip_vs_nq               16384  0
ip_vs_dh               16384  0
ip_vs_lc               16384  0
ip_vs_sh               16384  25
ip_vs_wrr              16384  0
ip_vs_rr               16384  0
ip_vs                 176128  39 ip_vs_rr,ip_vs_dh,ip_vs_sh,ip_vs_nq,ip_vs_wrr,ip_vs_lc,ip_vs_sed
nf_conntrack          172032  6 xt_conntrack,nf_nat,xt_nat,nf_conntrack_netlink,xt_MASQUERADE,ip_vs
nf_defrag_ipv6         24576  2 nf_conntrack,ip_vs
libcrc32c              16384  6 nf_conntrack,nf_nat,btrfs,nf_tables,raid456,ip_vs
kube-proxyの設定は、configmapで定義されています。
そのため、該当箇所(ipvsのschedulerとmode)を変更します。
kubeuser@master01:~$ kubectl get cm -n kube-system
NAME                                 DATA   AGE
calico-config                        4      12d
coredns                              1      12d
extension-apiserver-authentication   6      12d
kube-proxy                           2      12d
kube-root-ca.crt                     1      12d
kubeadm-config                       1      12d
kubelet-config                       1      12d

kubeuser@master01:~$ kubectl get cm -n kube-system kube-proxy -o yaml
apiVersion: v1
data:
  config.conf: |-
    apiVersion: kubeproxy.config.k8s.io/v1alpha1
    bindAddress: 0.0.0.0
    bindAddressHardFail: false
    clientConnection:
      acceptContentTypes: ""
      burst: 0
      contentType: ""
      kubeconfig: /var/lib/kube-proxy/kubeconfig.conf
      qps: 0
    clusterCIDR: 10.0.0.0/16,fd12:b5e0:383e::/64
    configSyncPeriod: 0s
    conntrack:
      maxPerCore: null
      min: null
      tcpCloseWaitTimeout: null
      tcpEstablishedTimeout: null
    detectLocal:
      bridgeInterface: ""
      interfaceNamePrefix: ""
    detectLocalMode: ""
    enableProfiling: false
    healthzBindAddress: ""
    hostnameOverride: ""
    iptables:
      localhostNodePorts: null
      masqueradeAll: false
      masqueradeBit: null
      minSyncPeriod: 0s
      syncPeriod: 0s
    ipvs:
      excludeCIDRs: null
      minSyncPeriod: 0s
      scheduler: ""
      strictARP: false
      syncPeriod: 0s
      tcpFinTimeout: 0s
      tcpTimeout: 0s
      udpTimeout: 0s
    kind: KubeProxyConfiguration
    metricsBindAddress: ""
    mode: ""
    nodePortAddresses: null
    oomScoreAdj: null
    portRange: ""
    showHiddenMetricsForVersion: ""
    winkernel:
      enableDSR: false
      forwardHealthCheckVip: false
      networkName: ""
# Please edit the object below. Lines beginning with a '#' will be ignored,
# and an empty file will abort the edit. If an error occurs while saving this file will be
# reopened with the relevant failures.
#
apiVersion: v1
data:
  config.conf: |-
    apiVersion: kubeproxy.config.k8s.io/v1alpha1
    bindAddress: 0.0.0.0
    bindAddressHardFail: false
    clientConnection:
      acceptContentTypes: ""
      burst: 0
      contentType: ""
      kubeconfig: /var/lib/kube-proxy/kubeconfig.conf
      qps: 0
    clusterCIDR: 10.0.0.0/16,fd12:b5e0:383e::/64
    configSyncPeriod: 0s
    conntrack:
      maxPerCore: null
      rootHnsEndpointName: ""
      sourceVip: ""
  kubeconfig.conf: |-
    apiVersion: v1
    kind: Config
    clusters:
    - cluster:
        certificate-authority: /var/run/secrets/kubernetes.io/serviceaccount/ca.crt
        server: https://master01:6443
      name: default
    contexts:
    - context:
        cluster: default
        namespace: default
        user: default
      name: default
    current-context: default
    users:
    - name: default
      user:
        tokenFile: /var/run/secrets/kubernetes.io/serviceaccount/token
kind: ConfigMap
metadata:
  annotations:
    kubeadm.kubernetes.io/component-config.hash: sha256:e1193cefc1046d8fe6dbffed62d04e546bd4142781cc28f632adfe72f499e4be
  creationTimestamp: "2023-03-14T13:45:56Z"
  labels:
    app: kube-proxy
  name: kube-proxy
  namespace: kube-system
  resourceVersion: "271"
  uid: 687e9c38-9699-46dc-9fbb-5de6bf270781
kubeuser@master01:~$ kubectl edit cm -n kube-system kube-proxy
configmap/kube-proxy edited

kubeuser@master01:~$ kubectl get cm kube-proxy -n kube-system -o yaml
.
.
.
    ipvs:
      excludeCIDRs: null
      minSyncPeriod: 0s
      scheduler: "rr"
      strictARP: false
      syncPeriod: 0s
      tcpFinTimeout: 0s
      tcpTimeout: 0s
      udpTimeout: 0s
    kind: KubeProxyConfiguration
    metricsBindAddress: ""
    mode: "ipvs"
.
.
.
更新したconfigmapの内容を反映させるため、
kube-proxy(pod)を削除します。
※podは、その後 自動で起動します。
kubeuser@master01:~$ kubectl delete pods kube-proxy-2n7b2 -n kube-system
pod "kube-proxy-2n7b2" deleted

kubeuser@master01:~$ kubectl delete pods kube-proxy-7k425 -n kube-system
pod "kube-proxy-7k425" deleted

kubeuser@master01:~$ kubectl delete pods kube-proxy-c5pkt -n kube-system
pod "kube-proxy-c5pkt" deleted
起動したkube-proxyのpodは、
I0326 14:20:14.047849 1 server_others.go:248] "Using ipvs Proxier"
I0326 14:20:14.048263 1 server_others.go:250] "Creating dualStackProxier for ipvs"
となっていますね。
kubeuser@master01:~$ kubectl get pods -n kube-system
NAME                                      READY   STATUS    RESTARTS   AGE
calico-kube-controllers-57b57c56f-p6xds   1/1     Running   0          12d
calico-node-phmkb                         1/1     Running   0          12d
calico-node-wjdqx                         1/1     Running   0          12d
calico-node-xdkfv                         1/1     Running   0          12d
coredns-787d4945fb-6n79l                  1/1     Running   0          12d
coredns-787d4945fb-dfplr                  1/1     Running   0          12d
etcd-master01                             1/1     Running   3          12d
kube-apiserver-master01                   1/1     Running   2          12d
kube-controller-manager-master01          1/1     Running   0          12d
kube-proxy-2sdm6                          1/1     Running   0          20h
kube-proxy-dvrph                          1/1     Running   0          20h
kube-proxy-gpp8x                          1/1     Running   0          20h
kube-scheduler-master01                   1/1     Running   3          12d
metrics-server-6b6f9ccc7-qmtb9            1/1     Running   0          23h

kubeuser@master01:~$ kubectl logs kube-proxy-2sdm6 -n kube-system
I0326 14:20:10.451704       1 node.go:163] Successfully retrieved node IP: 192.168.1.45
I0326 14:20:10.452153       1 server_others.go:109] "Detected node IP" address="192.168.1.45"
I0326 14:20:14.047849       1 server_others.go:248] "Using ipvs Proxier"
I0326 14:20:14.048263       1 server_others.go:250] "Creating dualStackProxier for ipvs"
I0326 14:20:14.162812       1 proxier.go:462] "IPVS scheduler not specified, use rr by default"
I0326 14:20:14.163387       1 proxier.go:462] "IPVS scheduler not specified, use rr by default"
I0326 14:20:14.163447       1 ipset.go:116] "Ipset name truncated" ipSetName="KUBE-6-LOAD-BALANCER-SOURCE-CIDR" truncatedName="KUBE-6-LOAD-BALANCER-SOURCE-CID"
I0326 14:20:14.163502       1 ipset.go:116] "Ipset name truncated" ipSetName="KUBE-6-NODE-PORT-LOCAL-SCTP-HASH" truncatedName="KUBE-6-NODE-PORT-LOCAL-SCTP-HAS"
I0326 14:20:14.164023       1 server.go:655] "Version info" version="v1.26.0"
I0326 14:20:14.164057       1 server.go:657] "Golang settings" GOGC="" GOMAXPROCS="" GOTRACEBACK=""
I0326 14:20:14.489671       1 conntrack.go:52] "Setting nf_conntrack_max" nf_conntrack_max=131072
I0326 14:20:14.541448       1 config.go:444] "Starting node config controller"
I0326 14:20:14.541714       1 shared_informer.go:273] Waiting for caches to sync for node config
I0326 14:20:14.542439       1 config.go:317] "Starting service config controller"
I0326 14:20:14.542471       1 shared_informer.go:273] Waiting for caches to sync for service config
I0326 14:20:14.542730       1 config.go:226] "Starting endpoint slice config controller"
I0326 14:20:14.542800       1 shared_informer.go:273] Waiting for caches to sync for endpoint slice config
I0326 14:20:14.922644       1 shared_informer.go:280] Caches are synced for endpoint slice config
I0326 14:20:15.241990       1 shared_informer.go:280] Caches are synced for node config
I0326 14:20:15.343632       1 shared_informer.go:280] Caches are synced for service config
E0326 14:20:17.079817       1 service_health.go:141] "Failed to start healthcheck" err="listen tcp :31402: bind: address already in use" node="worker01" service="ingress-nginx/ingress-nginx-controller" port=31402
トラフィック分散の確認
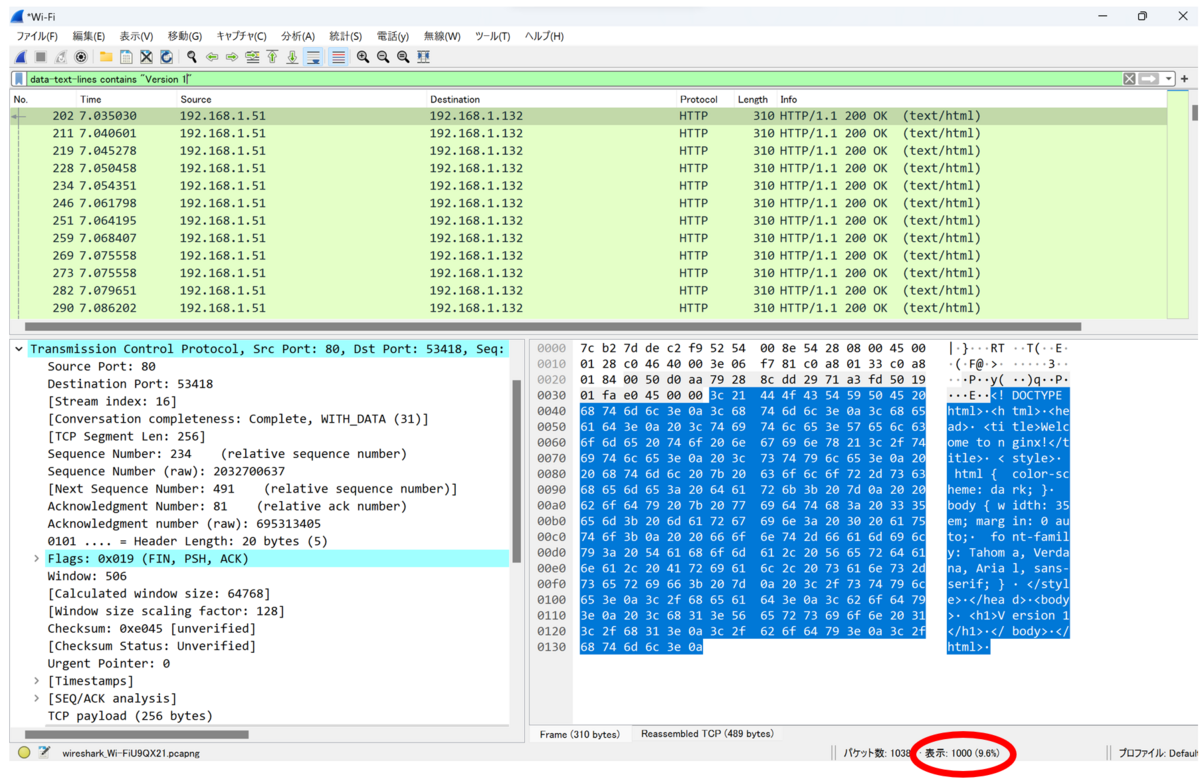
ipvsモード(rr:ラウンドロビン)の挙動を確認します。
前回同様に、
XAMPP(apache bench)で1,000リクエスト投げてみます。
c:\xampp\apache\bin>ab.exe -n 1000 -c 1000 http://192.168.1.51/
This is ApacheBench, Version 2.3 <$Revision: 1901567 $>
Copyright 1996 Adam Twiss, Zeus Technology Ltd, http://www.zeustech.net/
Licensed to The Apache Software Foundation, http://www.apache.org/

Benchmarking 192.168.1.51 (be patient)
Completed 100 requests
Completed 200 requests
Completed 300 requests
Completed 400 requests
Completed 500 requests
Completed 600 requests
Completed 700 requests
Completed 800 requests
Completed 900 requests
Completed 1000 requests
Finished 1000 requests


Server Software:        nginx/1.23.0
Server Hostname:        192.168.1.51
Server Port:            80

Document Path:          /
Document Length:        256 bytes

Concurrency Level:      1000
Time taken for tests:   3.660 seconds
Complete requests:      1000
Failed requests:        333
   (Connect: 0, Receive: 0, Length: 333, Exceptions: 0)
Total transferred:      489333 bytes
HTML transferred:       256333 bytes
Requests per second:    273.25 [#/sec] (mean)
Time per request:       3659.664 [ms] (mean)
Time per request:       3.660 [ms] (mean, across all concurrent requests)
Transfer rate:          130.58 [Kbytes/sec] received

Connection Times (ms)
              min  mean[+/-sd] median   max
Connect:        1    3   2.2      3      21
Processing:   159 1884 953.1   1917    3509
Waiting:        5 1807 990.5   1842    3491
Total:        161 1887 952.9   1919    3512

Percentage of the requests served within a certain time (ms)
  50%   1919
  66%   2412
  75%   2678
  80%   2841
  90%   3208
  95%   3366
  98%   3456
  99%   3481
 100%   3512 (longest request)
Wiresharkで確認すると、きれいに分散されていますね。

ipvsモード(sh:送信元IPハッシュ)に変更する
ipvsモード(sh:送信元IPハッシュ)も使ってみました。
今回の試験環境だとクライアントIPは一つなので、
想定通り一つのPod(コンテナ)に偏っています。
おわりに
前回知ったipvsモードを使ってみましたが、なかなか面白いですね♪
処理する通信の要件にもよるけど、lc(最小コネクション)がいいかなと思う次第。
また、一度LoadBalancer(NW機器)など使ったことあると、
トラフィック分散方式の理解がしやすくてよさそうです。
補足
なお、kubernetesクラスター構築時にkube-proxyのモードをipvsにする場合、
以下を参考にすれば大丈夫ですね。
https://github.com/kubernetes/kubernetes/blob/master/pkg/proxy/ipvs/README.md
