LinuCエヴァンジェリストの鯨井貴博@opensourcetechです。
はじめに
今回は、kubernetesでPod(コンテナ)へのアクセスってどのような分散がされるのか確認してみます。
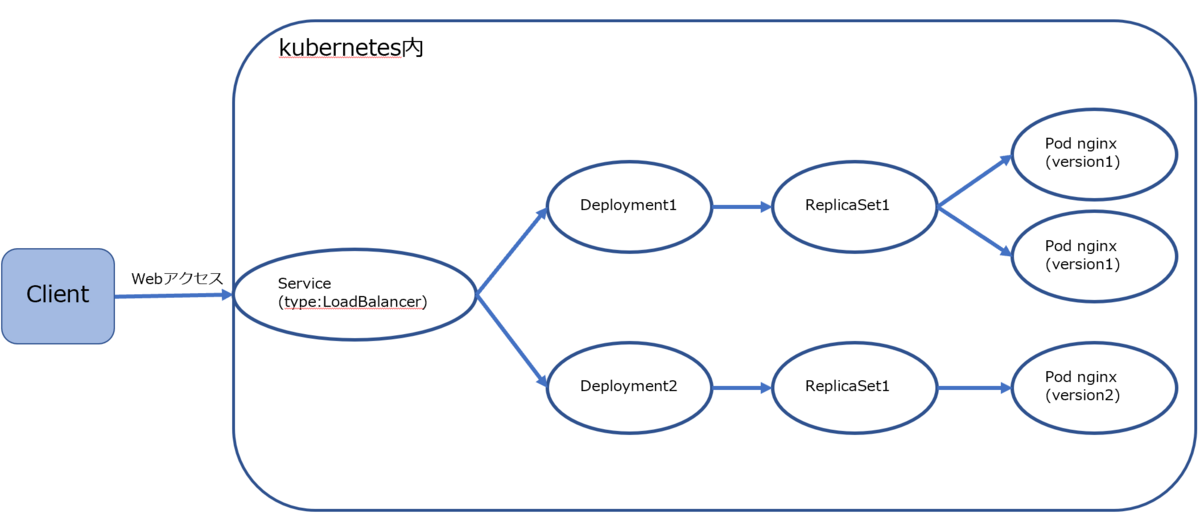
具体的には、こんな環境で実施します。
環境構築
まず、以下の記事を参考に"Deployment1"と"Deployment2"を作成します。
nginxコンテナ(Pod)のコンテンツ(index.html)をConfigMapで提供・更新する(kubernetes)
https://www.opensourcetech.tokyo/?page=1679832639
kubeuser@master01:~/variable_deploy$ kubectl get deployments
NAME     READY   UP-TO-DATE   AVAILABLE   AGE
nginx    2/2     2            2           3d
nginx2   1/1     1            1           3d
kubeuser@master01:~/variable_deploy$ kubectl get pods
NAME                     READY   STATUS    RESTARTS   AGE
nginx-6cbc9bb4f5-jm8mr   1/1     Running   0          2d8h
nginx-6cbc9bb4f5-pfhfz   1/1     Running   0          3d
nginx2-f96cfc57b-vnsfm   1/1     Running   0          3d
以下に使ったyamlファイルやindex.htmlを格納しています。
https://github.com/kujiraitakahiro/kubernetes/tree/master/kanarya_release
そして、Serviceを使ってクライアントがアクセスするIPアドレス&ポート番号を作成します。
kubeuser@master01:~/variable_deploy$ kubectl expose deployment nginx --port=80 --type=LoadBalancer

kubeuser@master01:~/variable_deploy$ kubectl get svc
NAME         TYPE           CLUSTER-IP    EXTERNAL-IP    PORT(S)        AGE
kubernetes   ClusterIP      10.1.0.1      <none>         443/TCP        11d
nginx        LoadBalancer   10.1.55.116   192.168.1.51   80:30267/TCP   3d
負荷分散状況の測定
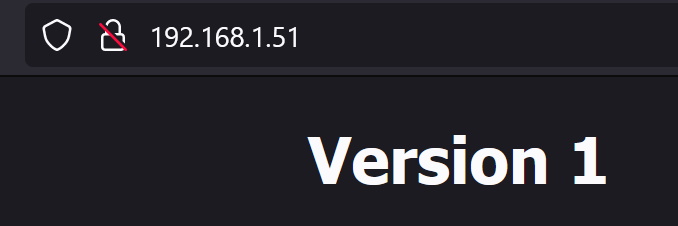
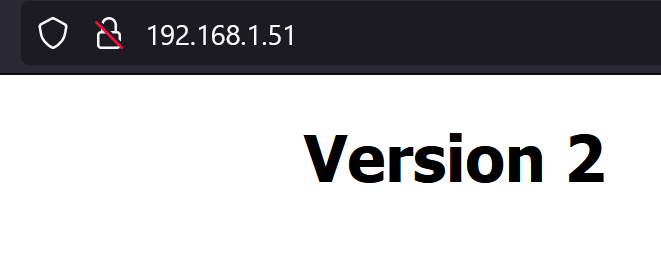
まず、クライアント(Webブラウザ)からアクセスできるかの確認。
大丈夫ですね!
※F5(再読み込み)を実施すると、Version1/Version2いずれかのコンテンツが表示されます。
では、分散状況のチェック。
Apache Benchを使って1,000アクセスしてみます。
※今回は、windowsでXAMPPを使っています。
c:\xampp\apache\bin>ab.exe -n 1000 -c 1000 http://192.168.1.51/
This is ApacheBench, Version 2.3 <$Revision: 1901567 $>
Copyright 1996 Adam Twiss, Zeus Technology Ltd, http://www.zeustech.net/
Licensed to The Apache Software Foundation, http://www.apache.org/

Benchmarking 192.168.1.51 (be patient)
Completed 100 requests
Completed 200 requests
Completed 300 requests
Completed 400 requests
Completed 500 requests
Completed 600 requests
Completed 700 requests
Completed 800 requests
Completed 900 requests
Completed 1000 requests
Finished 1000 requests


Server Software:        nginx/1.23.0
Server Hostname:        192.168.1.51
Server Port:            80

Document Path:          /
Document Length:        256 bytes

Concurrency Level:      1000
Time taken for tests:   3.817 seconds
Complete requests:      1000
Failed requests:        325
   (Connect: 0, Receive: 0, Length: 325, Exceptions: 0)
Total transferred:      489325 bytes
HTML transferred:       256325 bytes
Requests per second:    261.97 [#/sec] (mean)
Time per request:       3817.165 [ms] (mean)
Time per request:       3.817 [ms] (mean, across all concurrent requests)
Transfer rate:          125.19 [Kbytes/sec] received

Connection Times (ms)
              min  mean[+/-sd] median   max
Connect:        1    3   2.5      3      44
Processing:   217 1931 968.8   1935    3618
Waiting:        5 1831 1015.0   1841    3588
Total:        222 1934 968.7   1938    3620

Percentage of the requests served within a certain time (ms)
  50%   1938
  66%   2456
  75%   2723
  80%   2927
  90%   3290
  95%   3452
  98%   3553
  99%   3582
 100%   3620 (longest request)
アクセス状況はwiresharkを使います。
1,000アクセスに対して、200OKが返されています。
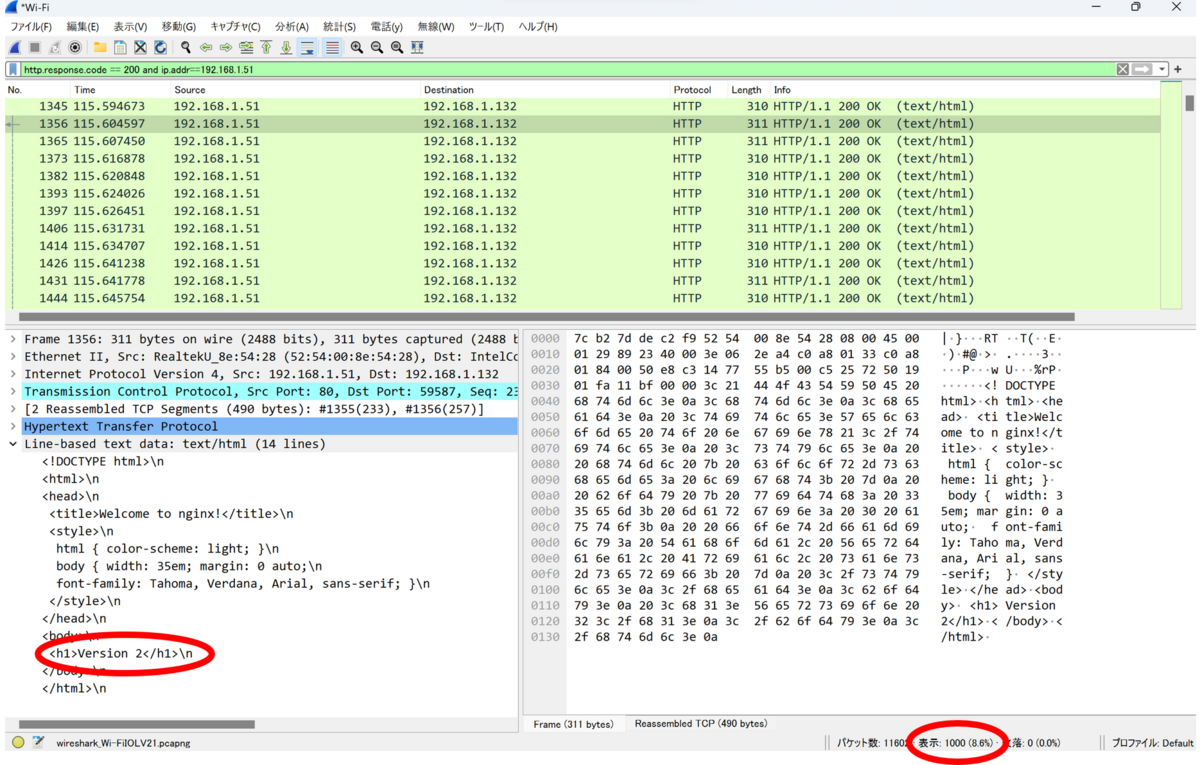
では、そのうちVersion2のコンテンツはどれくらい表示されるのか確認します。
すると、325回であることが分かります。
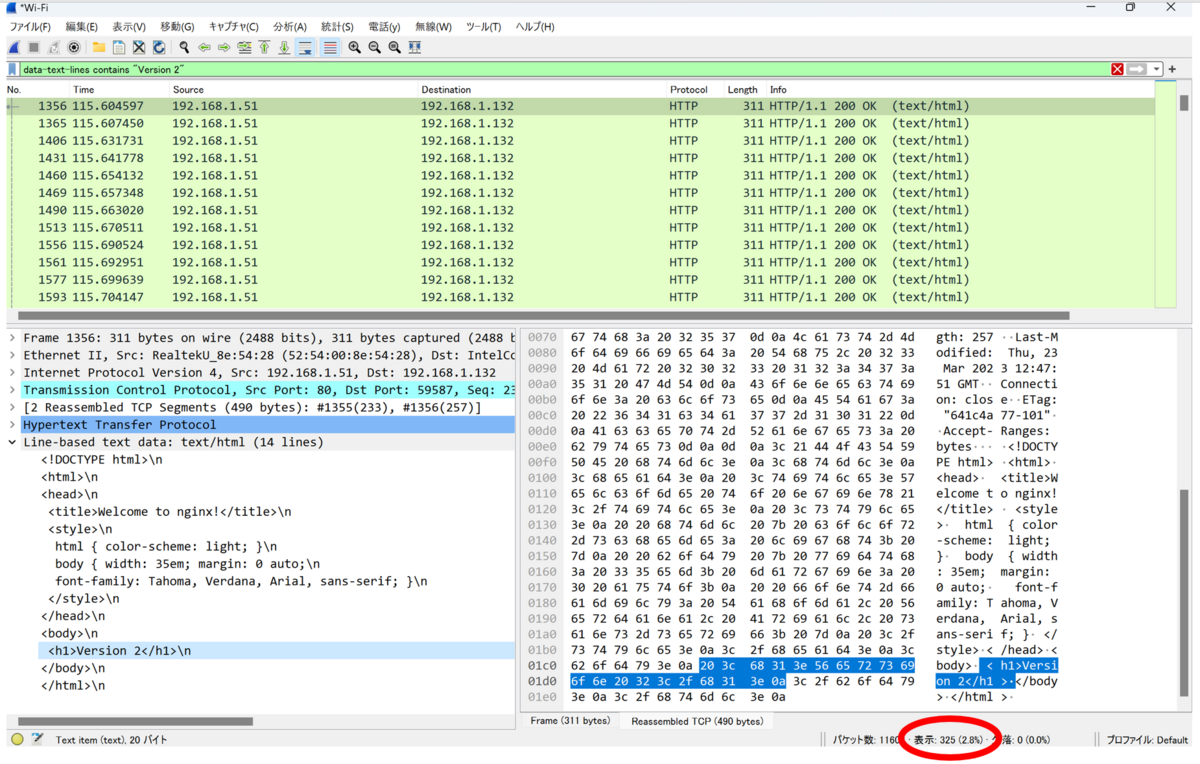
「均等にならないものなの?」という疑問が沸いたので、何度か試してみました。
結果は、339回・306回・353回・ 342回。
きっちりではないですが、だいたい均等に分散していま
https://kubernetes.io/ja/docs/concepts/services-networking/service/#proxy-mode-iptablesすね。
おわりに
実施する前はきれいに分散するのかなと思っていたのですが、
実際にはだいたい均等でした。
なんとなくリソースの負荷見ながら(least-connection) 均等分散(round-robin)しているのかなというように見えるのですが、合ってるんだろうか。。。
もうちょっと調べてみよう。
追記
Serviceのトラフィック分散について、追記。
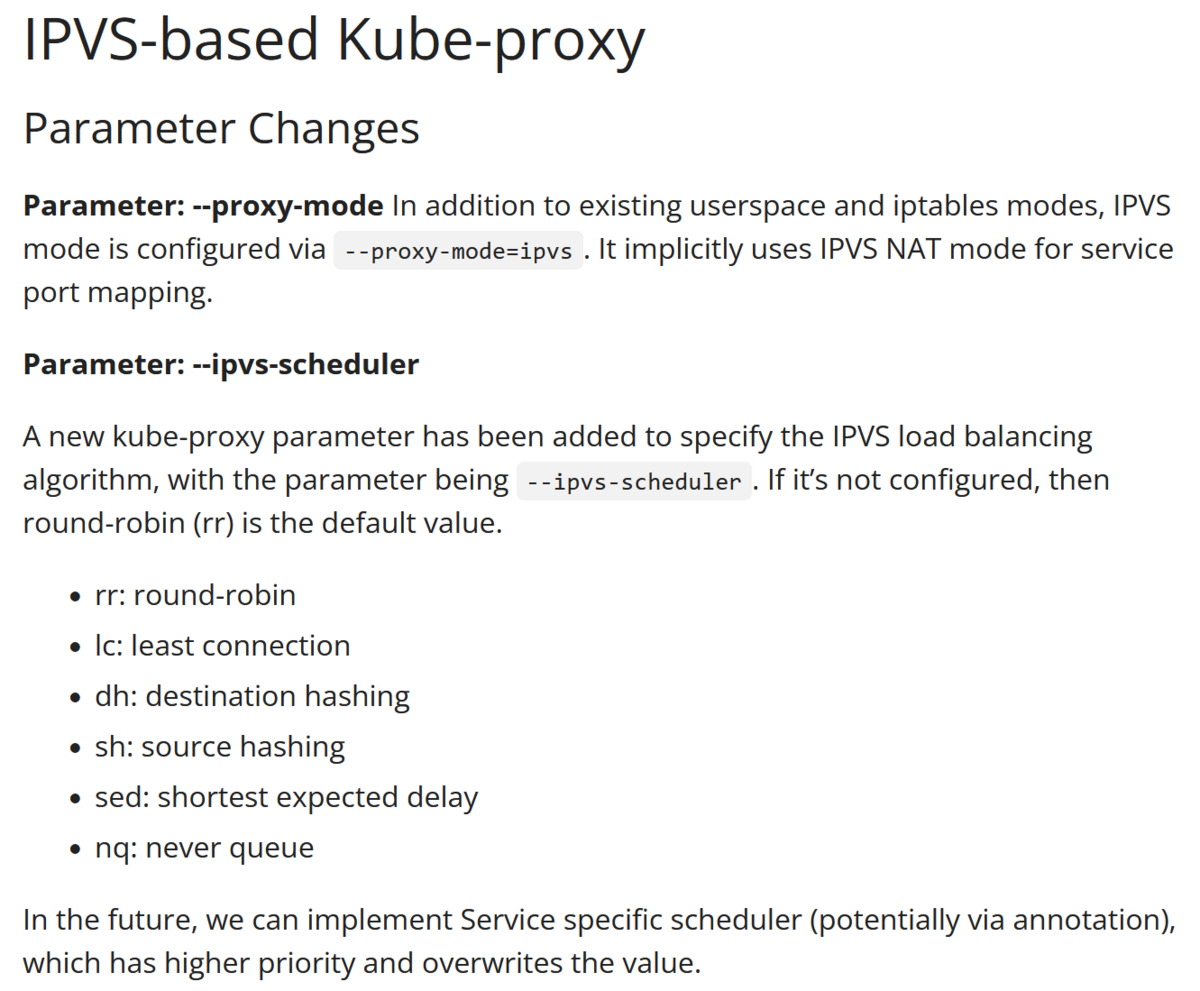
kube-proxyが関連しており、ipvsモード・iptablesモードがあるが、
デフォルトは後者(iptablesモード)。
https://kubernetes.io/ja/docs/concepts/services-networking/service/#proxy-mode-iptables
kube-proxyの設定(configmap)のmode ""のデフォルトがiptablesモード、
ipvsとすればipvsモードとなる。
また、ipvsモードだと、scheduler:でrr(ラウンドロビン)など選択可能。
kubeuser@master01:~$ kubectl get cm -n kube-system
NAME                                 DATA   AGE
calico-config                        4      12d
coredns                              1      12d
extension-apiserver-authentication   6      12d
kube-proxy                           2      12d
kube-root-ca.crt                     1      12d
kubeadm-config                       1      12d
kubelet-config                       1      12d
kubeuser@master01:~$ kubectl get cm -n kube-system kube-proxy -o yaml
apiVersion: v1
data:
  config.conf: |-
    apiVersion: kubeproxy.config.k8s.io/v1alpha1
    bindAddress: 0.0.0.0
    bindAddressHardFail: false
    clientConnection:
      acceptContentTypes: ""
      burst: 0
      contentType: ""
      kubeconfig: /var/lib/kube-proxy/kubeconfig.conf
      qps: 0
    clusterCIDR: 10.0.0.0/16,fd12:b5e0:383e::/64
    configSyncPeriod: 0s
    conntrack:
      maxPerCore: null
      min: null
      tcpCloseWaitTimeout: null
      tcpEstablishedTimeout: null
    detectLocal:
      bridgeInterface: ""
      interfaceNamePrefix: ""
    detectLocalMode: ""
    enableProfiling: false
    healthzBindAddress: ""
    hostnameOverride: ""
    iptables:
      localhostNodePorts: null
      masqueradeAll: false
      masqueradeBit: null
      minSyncPeriod: 0s
      syncPeriod: 0s
    ipvs:
      excludeCIDRs: null
      minSyncPeriod: 0s
      scheduler: ""
      strictARP: false
      syncPeriod: 0s
      tcpFinTimeout: 0s
      tcpTimeout: 0s
      udpTimeout: 0s
    kind: KubeProxyConfiguration
    metricsBindAddress: ""
    mode: ""
    nodePortAddresses: null
    oomScoreAdj: null
    portRange: ""
    showHiddenMetricsForVersion: ""
    winkernel:
      enableDSR: false
      forwardHealthCheckVip: false
      networkName: ""
      rootHnsEndpointName: ""
      sourceVip: ""
  kubeconfig.conf: |-
    apiVersion: v1
    kind: Config
    clusters:
    - cluster:
        certificate-authority: /var/run/secrets/kubernetes.io/serviceaccount/ca.crt
        server: https://master01:6443
      name: default
    contexts:
    - context:
        cluster: default
        namespace: default
        user: default
      name: default
    current-context: default
    users:
    - name: default
      user:
        tokenFile: /var/run/secrets/kubernetes.io/serviceaccount/token
kind: ConfigMap
metadata:
  annotations:
    kubeadm.kubernetes.io/component-config.hash: sha256:e1193cefc1046d8fe6dbffed62d04e546bd4142781cc28f632adfe72f499e4be
  creationTimestamp: "2023-03-14T13:45:56Z"
  labels:
    app: kube-proxy
  name: kube-proxy
  namespace: kube-system
  resourceVersion: "271"
  uid: 687e9c38-9699-46dc-9fbb-5de6bf270781
kube-proxyの設定について
https://kubernetes.io/docs/reference/config-api/kube-proxy-config.v1alpha1/#kubeproxy-config-k8s-io-v1alpha1-ProxyMode
ipvsモードのDeep Dive
https://kubernetes.io/docs/reference/config-api/kube-proxy-config.v1alpha1/#kubeproxy-config-k8s-io-v1alpha1-ProxyMode
